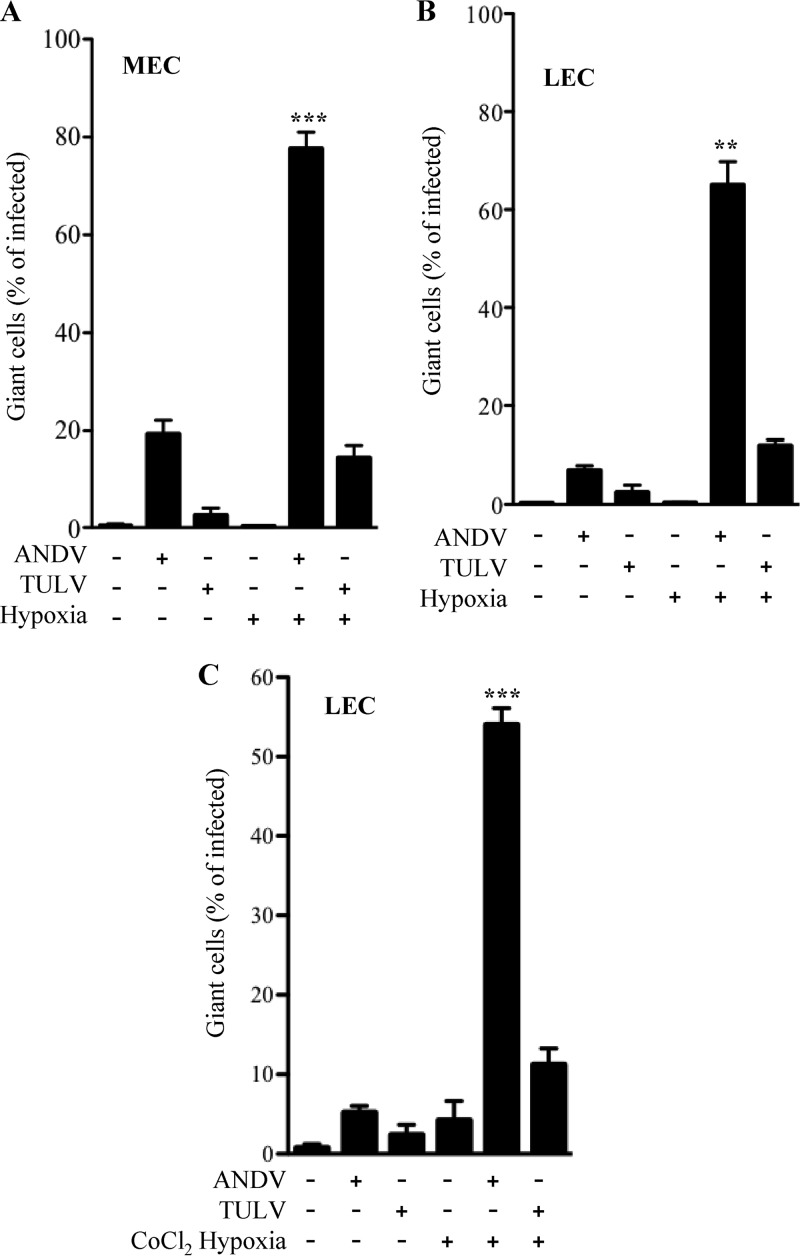
Fig 3.
ANDV and hypoxia induce giant cell responses. MECs (A) and LECs (B and C) were infected with ANDV or TULV or mock infected under normoxic or hypoxic conditions as in Fig. 1 (47, 49–52). LECs were infected as described above and 3 days postinfection treated with CoCl2 (100 mM) for 6 h to induce hypoxia under normoxic incubator conditions (C). Cells were methanol fixed, immunoperoxidase stained for N protein, and visualized by light microscopy. Hantavirus-infected giant cells (∼3× normal size) were measured and quantified using NIH Image and expressed as a percentage of total infected cells (47, 49–52). The data represent results from six independent experiments (**, P < 0.01, and ***, P < 0.001, versus ANDV- or TULV-infected levels).

