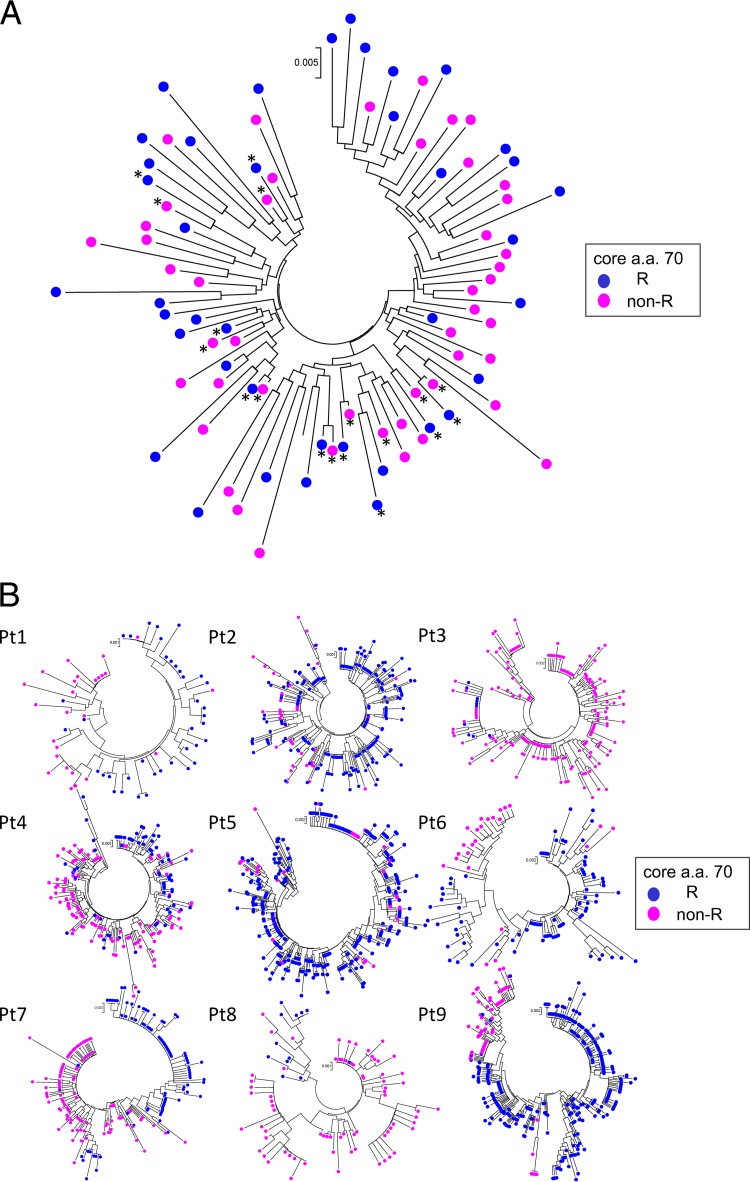
Fig 3.
Phylogenetic trees were constructed using core sequences covering almost the entire core region. In the construction of those trees, the three bases of the core 70 codon were removed in the analysis of all 79 patients. Branches with core aa 70R are indicated by blue circles, while those with core aa 70non-R are indicated by pink circles. (A) Phylogenetic trees were constructed for all 79 patients by using dominant core sequences obtained from each patient. In the construction of the tree, two dominant sequences (a dominant core sequence in isolates with aa 70R and a dominant core sequence in isolates with aa 70non-R) were included in the analysis for each of the nine patients with high mixture rates (5% or more) of R and non-R at core aa 70 (Fig. 2A), while one dominant sequence each was included for other patients. (B) A phylogenetic tree of the core region was constructed for each patient with a high mixture rate (5% or more) of core aa 70R and core aa 70non-R. A total of nine patients were included in this analysis (patients 1 to 3 had CH; patients 4 to 7 had LC; and patients 9 and 10 had HCC). Pt, patient.

