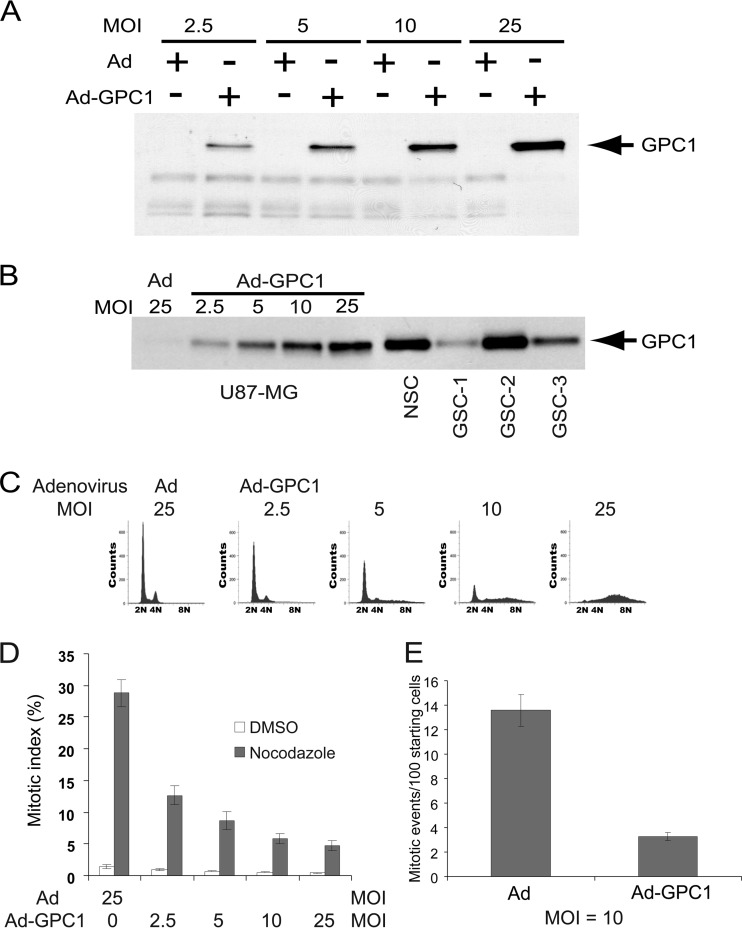
Fig 1.
Ectopic expression of GPC1 in U87-MG cells induces an aneuploid DNA profile prior to G2/M phases. (A) 3G10 immunoblotting of U87-MG cells. The cells were infected with control adenovirus (Ad) or GPC1 adenovirus (Ad-GPC1) for 48 h at different doses as indicated. Cell-associated HSPGs were isolated, and immunoblotting analysis was performed using the anti-pan-HSPG antibody 3G10. (B) Comparison of GPC1 levels between GPC1-transduced U87-MG cells, cultured human neural stem cells (NSCs), and glioma stem-like cells (GSCs). U87-MG cells were infected with control or GPC1 adenovirus for 48 h. Total HSPGs were isolated, and 3G10 immunoblotting was performed. (C) DNA profile. The cells were infected with different doses of control or GPC1 adenovirus for 48 h, and the DNA profile was analyzed by flow cytometry after propidium iodide (PI) staining. (D) Mitotic index. The cells were infected with different doses of control or GPC1 adenovirus for 30 h, and then dimethyl sulfoxide (DMSO) or 500 ng/ml nocodazole was added. At 48 h from the start of infection, the cells were harvested, and mitotic cells were counted after Giemsa staining. Each bar represents the mean ± standard error (SE) from three independent experiments. (E) Time-lapse live-cell imaging. GFP-H2B-U87-MG cells were established by stable transfection of U87-MG cells with a GFP-H2B cDNA. The GFP-labeled cells were infected with control or GPC1 adenovirus at an MOI of 10, and time-lapse live-cell imaging was conducted on a Nikon Eclipse Ti inverted microscope at time intervals of 10 min, starting at 24 h after adding adenoviruses. The number of mitotic events per 100 cells present at the start during the first 24 h of imaging (between 24 and 48 h after adding adenoviruses) was determined. Each bar represents the mean ± SE from three independent experiments.

