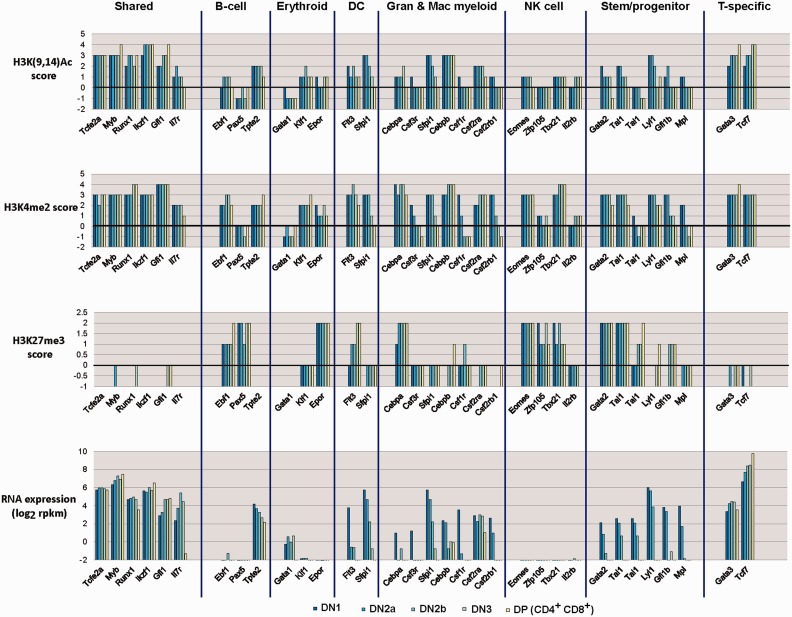
Figure 3:
Expression and histone modification changes in genes associated with non-T developmental potentials from precommitment to postcommitment stages of T-cell development. Data summarized are from reference [8], and show histone modification scores around transcriptional start sites of the genes correlated with their RNA expression levels as early T-lineage cells progress from multipotency to commitment (Figure 2). Genes for which data are displayed are grouped according to the developmental program(s) in which they play an important role. Colored bars show values for the indicated parameters in cells from precommitment (DN1, DN2a) to postcommitment (DN2b, DN3, DP) stages of early T-cell development (dark colors: earlier stages; light colors: later stages). For histone marks shown, any score of 0 or less is insignificant. Log2 RNA expression values above a score of 0–1 (1–2 rpkm) are significant. See text for additional discussion.

