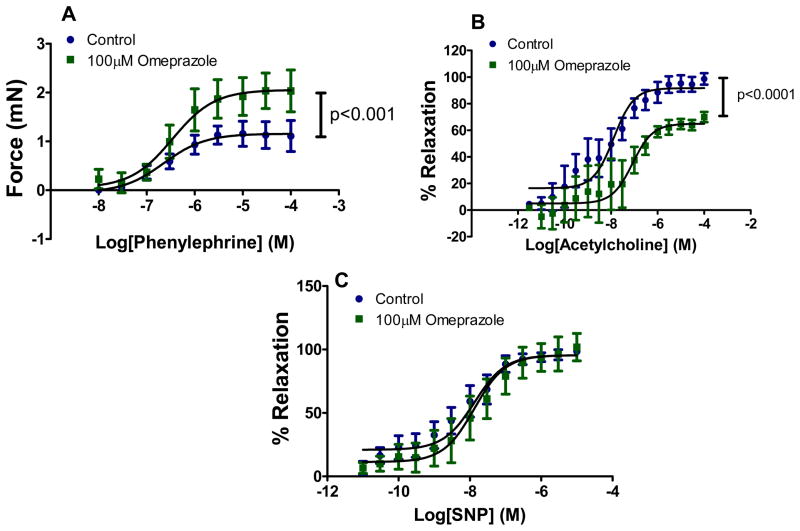
Figure 7.
Omeprazole impairs vascular reactivity in response to the pharmacological agents acetylcholine (ACh) and phenylephrine (PE) on isolated mouse aorta. Concentration response curve to A) PE (10−8 to 10−4 M) and B) ACh (10−12 to 10−4 M) are shown. In C) the percent relaxation in response to the endothelium-independent Sodium Nitroprusside (SNP; 10−12 to 10−5 M) is shown. Drug concentrations in each data set were log transformed and the PE concentration response curve (in Figure A) is expressed as force (mN) applied to the transducer of the myograph for each dose of the compound added. The ACh and SNP induced relaxation (in Figure B and C) is expressed in the concentration response curve as a percentage of the contraction to the 80% of the maximal contraction reached with PE. Differences in best-fit values of selected parameters (force, % relaxation) were compared between the PPI and vehicle groups (n=6 vessels at each drug conc. in each group) using extra sum-of-squares F test and the data are expressed as Mean ± SEM in each panel.

