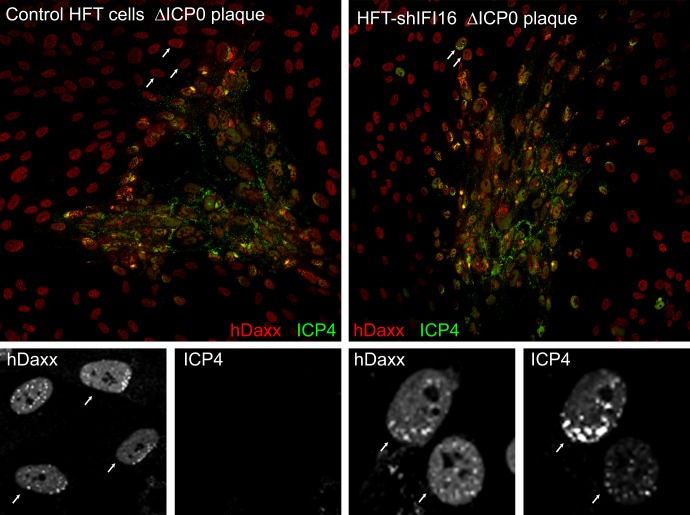
Fig 10.
Evidence for a reduced rate of response of hDaxx to the entry of HSV-1 genomes into the nucleus in IFI16-depleted cells. Control cells (left panels) and IFI16-depleted HFT cells (right panels) were infected with dl0Y4 at a low MOI, and plaques were examined by ICP4 autofluorescence and staining for hDaxx using an Alexa 633-linked anti-rabbit secondary antibody. The color images are a composite of arrays of 9 (control sample) or 16 (shIFI16 sample) images taken using a ×40 objective lens. Individual cells surrounding the core of the plaques and displaying clear asymmetric patterns of hDaxx staining were examined under zoom and scored for the presence of detectable ICP4 by switching off the red channel. The greyscale images below the color ones show the hDaxx and ICP4 channels of selected regions of the plaques. Other details and explanations are given in the text.

