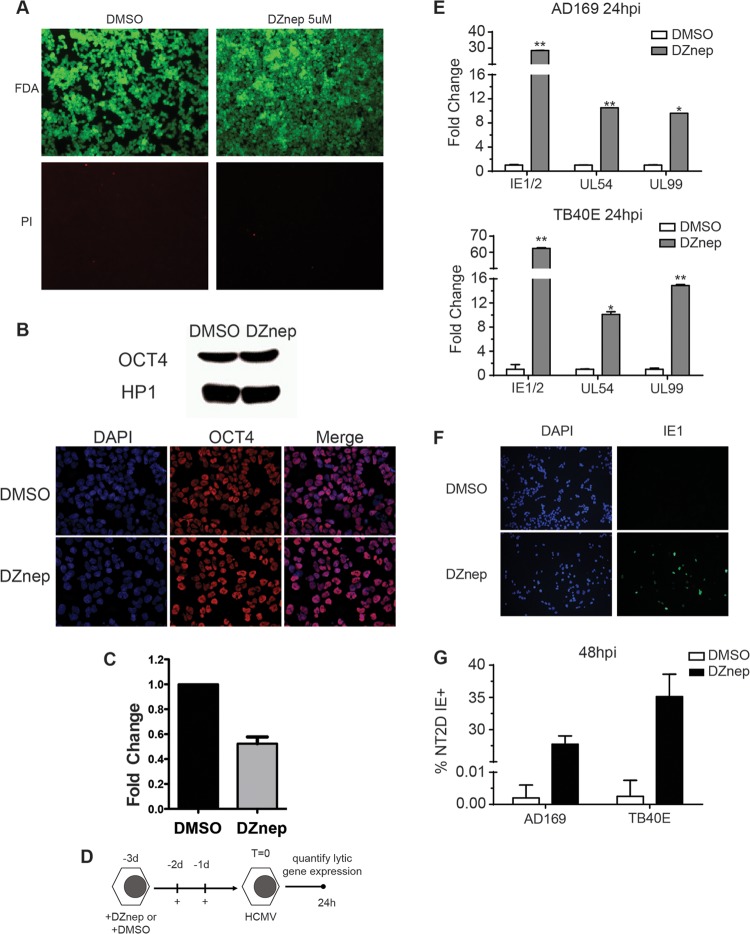
Fig 3.
DZnep treatment primes pluripotent NT2D1 cells for HCMV AD169 lytic gene expression. (A) Fluorescence microscopy of NT2D1 cells, treated as indicated, following FDA or PI staining for viability. (B) Differentiation analysis. (C) Quantification of viral copy numbers in infected treated cells. Total DNA was prepared at 2 hpi, and the relative viral copy number was quantified by qPCR. The relative genome copy number is reported as the mean fold change in the copy number from that in DMSO-treated cells for three biological replicates. Error bars, standard errors of the means. (D) Schematic diagram of the treatment and infection protocol. Cells were infected at an MOI of 1.0. (E) At 24 hpi, gene expression in cells pretreated with DMSO or DZnep and infected with AD169 or TB40 was analyzed as described in the legend to Fig. 2. Asterisks indicate P values of <0.05 (*) or <0.01 (**) by paired, two-tailed t tests. (F) IE1 protein accumulation in DZnep-treated NT2D1 cells. The expression of IE1 protein in NT2D1 cells infected with AD169 or TB40E at an MOI of 1.0 was analyzed by immunofluorescence at 48 hpi. (G) Quantification of IE1-positive cells from the immunofluorescence assay for which results are shown in panel F. Bars represent the mean percentages of cells staining positive for IE1 protein within a 10× field of magnification. Results are from four random fields of view. Error bars, standard errors of the means.

