Fig 4.
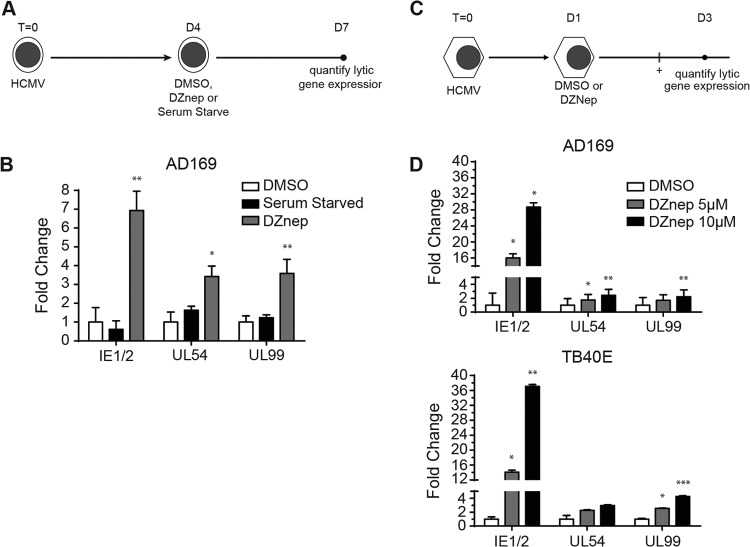
(A and B) DZnep treatment activates the AD169 lytic transcription program in quiescently infected THP1 monocytes. (A) Schematic diagram of the treatment and infection protocol. Cells were infected with AD169 at an MOI of 1.0. (B) HCMV lytic mRNA expression. qPCR was performed, and data were analyzed and graphed, as described in the legend to Fig. 2. Asterisks indicate P values of <0.05 (*) or <0.01 (**) by paired, two-tailed t tests. (C and D) DZnep treatment reactivates the HCMV lytic transcription program in pluripotent NT2D1 cells. (C) Schematic diagram of the treatment and infection protocol. Cells were infected with AD169 or TB40E at an MOI of 1.0. (D) AD169 or TB40E lytic gene mRNA expression. qPCR was performed, and data were analyzed and graphed, as described for Fig. 2. Asterisks indicate P values of <0.05 (*), <0.01 (**), or <0.001 (***) by paired, two-tailed t tests.

