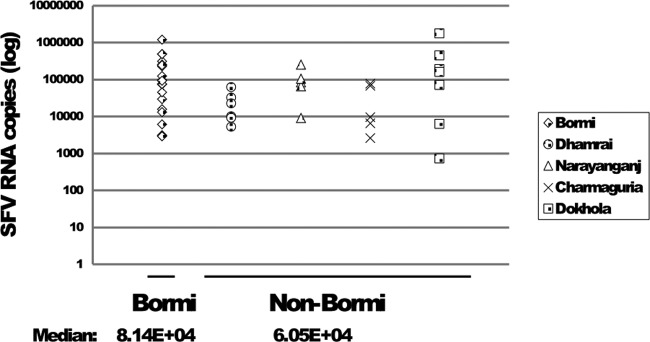
Fig 1.

SFV RNA copy numbers from buccal swabs grouped according to location. FV RNA was quantified as discussed in Materials and Methods. The median values for Bormi and non-Bormi samples were calculated and are shown below the x axis. Samples with FV RNA below the level of detection are not shown.
