Fig 3.
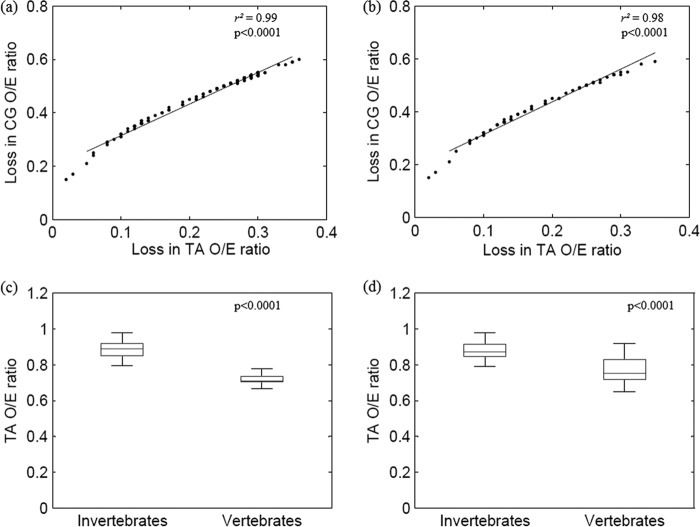
Depletion of CpG dinucleotides is linked to the loss of TpA dinucleotides. (a) Scatter plot demonstrating a strong correlation between the loss of CpG dinucleotides (y axis) and the loss of TpA dinucleotides (x axis); all autonomous parvovirus sequences studied were analyzed (n = 259). (b) Scatter plot demonstrating a strong correlation between the loss of CpG dinucleotides (y axis) and the loss of TpA dinucleotides (x axis) in a subset of sequences (one sequence each for every autonomous parvovirus; n = 56). (c) Box plot comparing the TpA O/E ratios between parvoviruses infecting invertebrates and vertebrates; all autonomous parvovirus sequences studied were analyzed (n = 259). The TpA O/E ratios are higher among parvoviruses infecting invertebrates than among those infecting vertebrates (0.89 ± 0.049 compared to 0.73 ± 0.049; P < 0.0001). (d) Box plot comparing the TpA O/E ratios between parvovirus infecting invertebrates and vertebrates in a subset of sequences analyzed (n = 56) (0.88 ± 0.05 compared to 0.77 ± 0.07; P < 0.0001).

