
Fig 4.
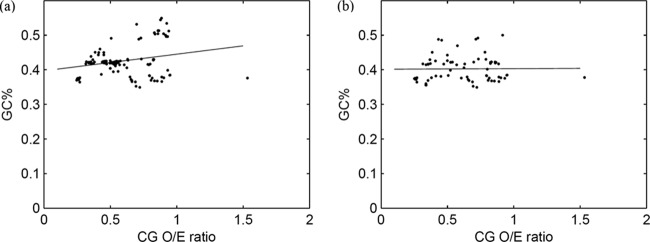
CpG depletion is not influenced by GC content. (a) Scatter plot demonstrating the lack of correlation between GC% (y axis) and CpG dinucleotide O/E ratio (x axis); all autonomous parvovirus sequences studied were analyzed (n = 259). (b) Scatter plot demonstrating the lack of correlation between GC% (y axis) and CpG dinucleotide O/E ratio (x axis); analysis done using a subset of sequences (one sequence each for every autonomous parvovirus; n = 56).