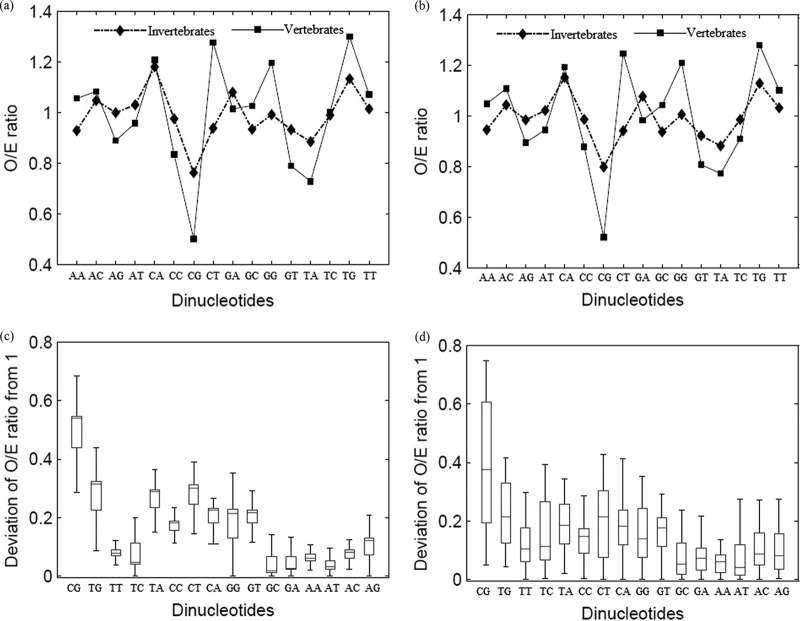
Fig 5.
Role of CpG depletion in parvovirus evolution. (a) Comparison of all dinucleotide O/E ratios between parvoviruses infecting invertebrates and those infecting vertebrates; all autonomous parvovirus sequences studied were analyzed (n = 259). CpG dinucleotides are the most depleted dinucleotides among parvoviruses infecting invertebrates and vertebrates (depletion of CpG dinucleotide compared to depletion of any other dinucleotide, P < 0.0001). (b) Comparison of all dinucleotide O/E ratios between parvoviruses infecting invertebrates and those infecting vertebrates in a subset of sequences (one sequence each for every autonomous parvovirus; n = 56). (c) Box plot comparing the deviation of the O/E ratio for each dinucleotide from 1 (the O/E ratio is 1 if the observed frequency equals the expected frequency); analysis done using all autonomous parvoviruses studied (n = 259). CpG dinucleotide O/E ratios are the most deviant among all dinucleotide ratios in autonomous parvoviruses, suggesting that CpG dinucleotide loss is more pronounced than the loss or gain of any other dinucleotide (deviation of CpG dinucleotide from 1 compared to deviation of any other dinucleotide from 1, P < 0.0001). (d) Box plot comparing the deviation of the O/E ratio for each dinucleotide from 1 (the O/E ratio is 1 if the observed frequency equals the expected frequency) in a subset of sequences (n = 56).

