Fig 1.
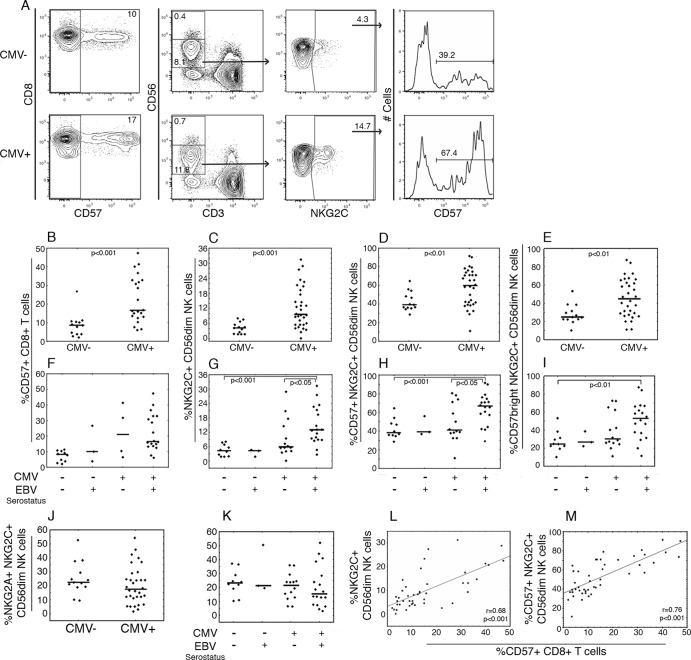
Phenotype of T and NK cells in relation to CMV and EBV serostatus. PBMC from CMV− (n = 13) and CMV+ (n = 32) 5-year-old children were phenotyped ex vivo. (A) Representative example of flow cytometric gating of viable CD14− CD19− CD8+ CD3+ and CD14− CD19− CD3− CD56dim lymphocytes for the proportion of CD57 and NKG2C expressing cells. (B to K) Proportions of CD57+ CD8+ T cells (B and F), NKG2C+ NK cells (C and G), CD57+ NKG2C+ NK cells (D and H), CD57bright NKG2C+ NK cells (E and I), and) NKG2A+ NKG2C+ NK cells (J and K) in CMV− and CMV+ groups and after subdivision with regard to EBV serostatus. (L and M) Spearman analysis of correlation between the proportions of CD57+ CD8+ T cells and NKG2C+ NK cells (L) or between CD57+ CD8+ T cells and CD57+ NKG2C+ NK cells (M). Filled circles depict outlier values.

