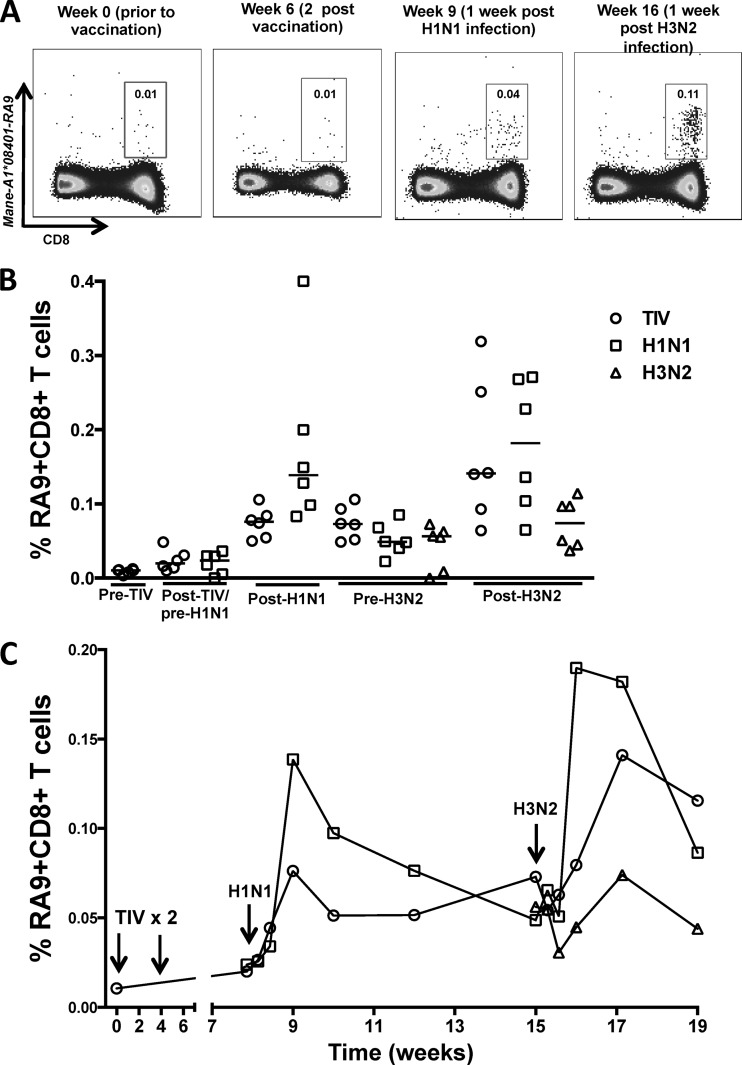
Fig 7.
Influenza virus-specific CD8 T cell responses over time following TIV vaccination and influenza virus infection of macaques. (A) Representative plots of Mane-A1*08401–RA9 tetramer-positive CD3− CD8+ T cells from a vaccinated H1N1- and H3N2-infected macaque (animal C3752) at week 0 prior to TIV vaccination, week 2 post-second TIV vaccination, week 1 post-H1N1 infection, and week 1 post-H3N2 infection. (B) Frequencies of RA9-specific T cells in 6 vaccinated H1N1-H3N2 macaques (TIV), 6 unvaccinated H1N1-H3N2 macaques (H1N1), and 6 H3N2 macaques (H3N2) at time points prior to TIV vaccination (Fig. 1 shows the groups), 4 weeks after the final TIV vaccination/pre-H1N1 infection, 1 week post-H1N1 infection (Post-H1N1), pre-H3N2 infection, and 2 weeks post-H3N2 infection (Post-H3N2). The horizontal lines represent the median values of groups. (C) Time course of median frequencies of RA9-specific CD8 T cells from 6 vaccinated H1N1-H3N2 macaques (TIV), 6 unvaccinated H1N1-H3N2 macaques (H1N1), and 6 H3N2 macaques (H3N2).

