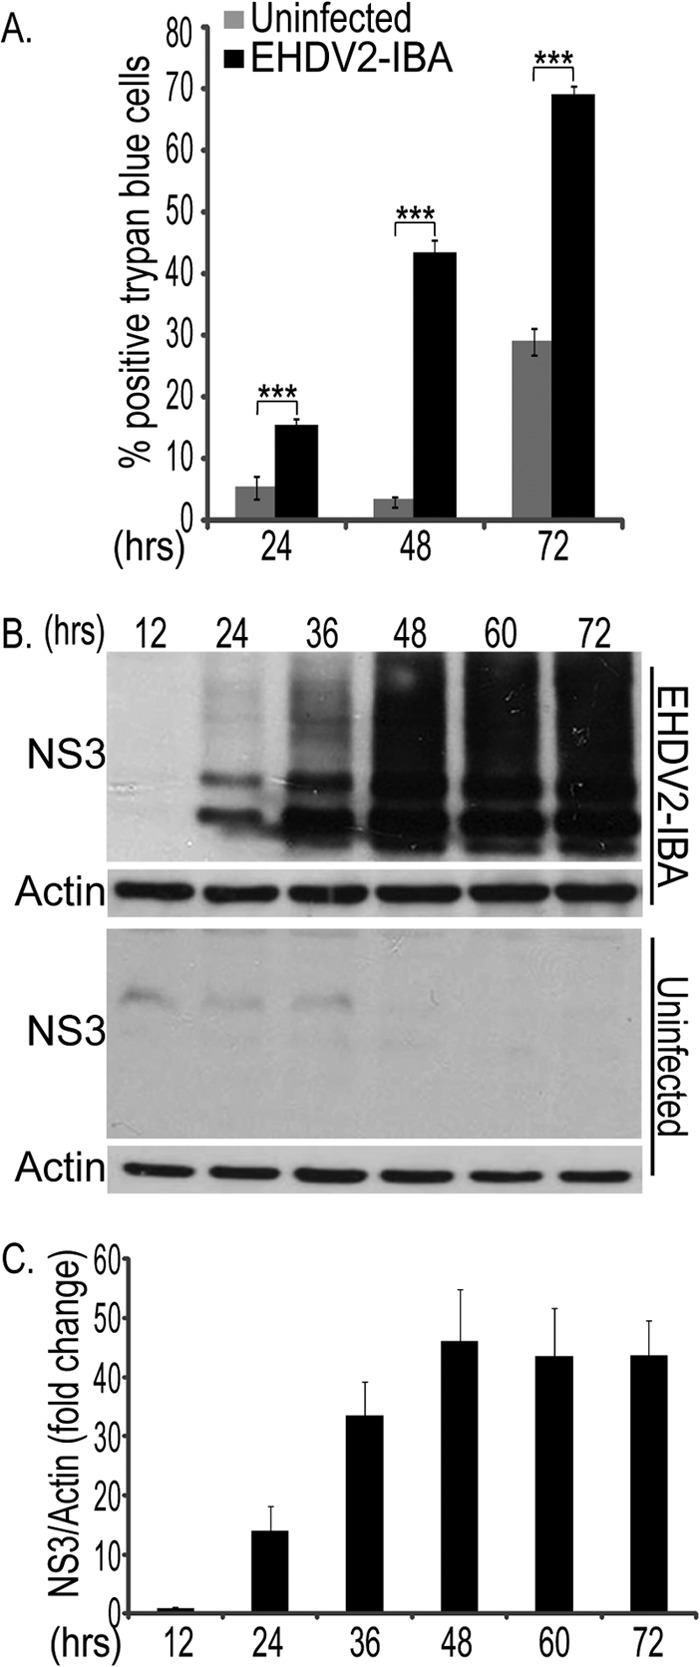
Fig 1.

Time course of EHDV2-IBA-induced cell death. OK cells, at 24 h postplating, were either noninfected or infected with EHDV2-IBA (here and throughout this study, at an MOI of 1) (for the method of calculation, see Materials and Methods). At indicated time points, cells were suspended by trypsinization, stained with trypan blue, and scored for trypan blue exclusion by microscopy. (A) The graph depicts the percentage of cells stained with trypan blue under the different experimental conditions (noninfected or infected with EHDV2-IBA) at different time points. ***, P < 0.005. (B) Representative immunoblot of lysates of OK cells, either noninfected or infected with EHDV2-IBA for the indicated times, separated by SDS-PAGE, and probed with anti-NS3 and antiactin antibodies. (C) Graph depicts the average ± SE fold change in the NS3/actin ratio at different time points of infection relative to the NS3/actin ratio at 12 hpi (taken as 1; n = 3).
