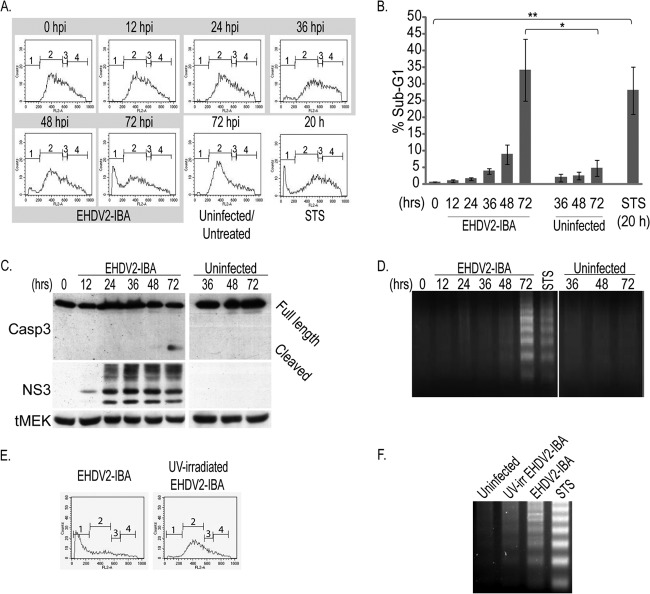
Fig 2.
EHDV2-IBA induces the apoptosis of OK cells. (A and B) Subconfluent cultures of OK cells, at 24 h postplating, were either noninfected or infected for the indicated times and left untreated or treated with staurosporine (STS; 1 μM for 20 h). Cells were collected from the medium or suspended by trypsinization and processed for FACS analysis. (A) The graphs depict the FACS measurements of DNA content of propidium iodide-stained OK cells: 1, sub-G1; 2, G0/G1; 3, S; 4,G2/M. (B) The graph shows the average ± SE of the percentage of cells presenting sub-G1 DNA content under the indicated experimental conditions (n = 3; *, P < 0.05; **, P < 0.01). (C) OK cells at 24 h postplating were noninfected or infected with EHDV2-IBA. At indicated times points, cells were collected and processed for 10% SDS-PAGE (see Materials and Methods). The panel depicts a typical immunoblot probed with the anti-NS3, anti-caspase 3, and anti-MEK (loading control) antibodies. tMEK, total MEK (MEK1/2). (D) Cells cultured and infected as described for panel C were processed for DNA laddering (see Materials and Methods) at the indicated time points. The panel depicts a representative DNA laddering experiment (n = 5) employing equal amounts of genomic DNA, extracted from cells under the indicated conditions, and separated on a 2% agarose gel. (E) OK cells, cultured as described for panel A and either noninfected or infected with UV-irradiated EHDV2-IBA for 72 h, were processed for FACS analysis of DNA content. Graphs depict typical FACS measurements of cells infected with EHDV2-IBA (left) or UV-irradiated EHDV2-IBA (right). (F) Representative agarose gel from a DNA laddering experiment of OK cells noninfected or infected with EHDV2-IBA or UV-irradiated EHDV2-IBA (60 hpi) and left untreated or treated with STS (1 μM for 20 h).

