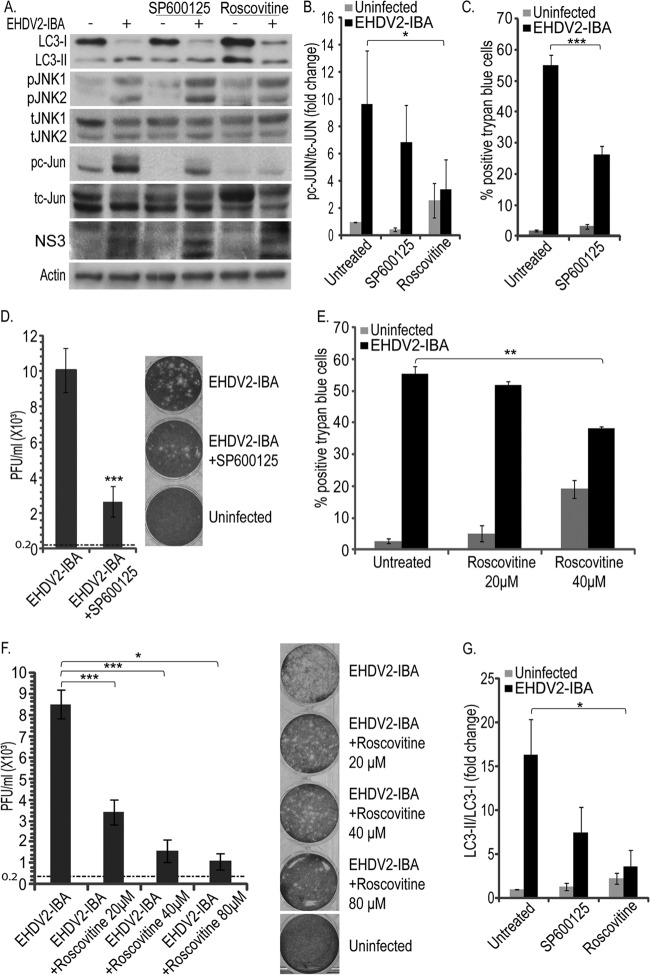
Fig 8.
SP600125 and roscovitine decrease EHDV2-IBA-mediated cell death and autophagy and the production of infectious virions. (A) OK cells at 24 h postplating were either noninfected or infected with EHDV2-IBA (for 48 h) and left untreated or treated with SP600125 (20 μM; 48 h) or roscovitine (80 μM; 48 h). Cell lysates were separated by 12% SDS-PAGE, blotted, and probed with antibodies against LC3, pJNK, tJNK, pc-Jun, tc-Jun, NS3, or actin. (B) Graph depicts the fold increase (average ± SE) in the pc-Jun/tc-Jun ratio (48 hpi) under the indicated treatment/infection conditions, relative to the uninfected untreated sample (taken as 1). *, P < 0.05. (C and E) OK cells were infected (for 48 h) and either left untreated or treated with SP600125 (20 μM; 48 h) (C) or roscovitine (20 μM, 40 μM or 80 μM; 48 h) (E). Graphs depict the average ± SE of the percentage of cells positive for trypan blue staining upon EHDV2-IBA infection and/or treatment. *, P < 0.05; ***, P < 0.005. (D and F) Plaque assay analyses of the effects of SP600125 (D) or roscovitine (F) on the increase in EHDV2-IBA titer at 48 hpi. Graphs depict the average ± SE of the titer (PFU/ml) of infectious virions under the indicated experimental conditions. The titer of the inoculum (0.2 × 10³ PFU/ml) is indicated as a horizontal dotted line. Panels show typical wells of the plaque assays employed for the quantification. *, P < 0.05; ***, P < 0.005. (G) The graph shows the fold change (average ± SE) in the LC3-II/LC3-I ratio (from immunoblots as described for panel A), relative to that of uninfected untreated samples (taken as 1). *, P < 0.05.

