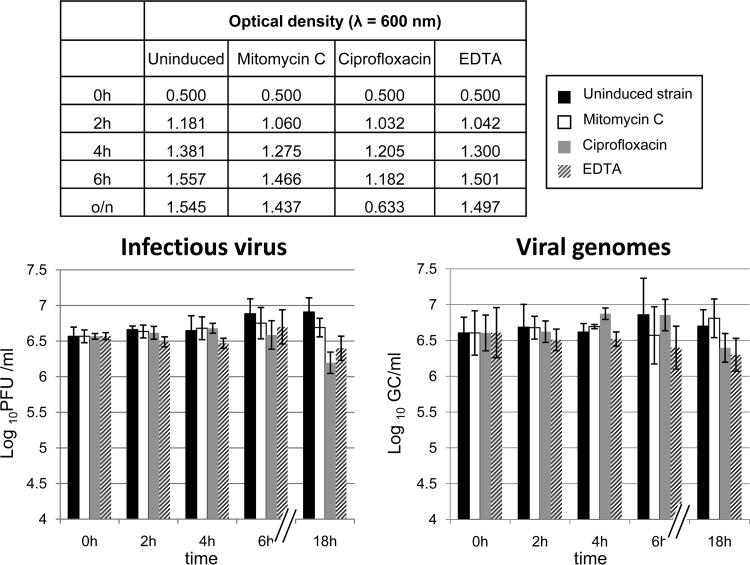
Fig 2.
Induction experiments of phage ΦAA91-ss using mitomycin, ciprofloxacin, and EDTA. Monitoring of induction was performed by spectrophotometry at a wavelength of 600 nm (upper table), infectiveness on E. coli WG5 in log10 PFU/ml (chart on the left), and evaluation of phage genomes by qPCR in log10GC/ml (chart on the right).

