Figure 1.
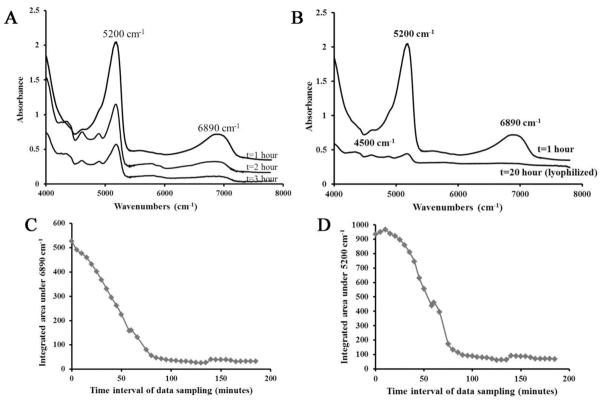
Absorbance spectra obtained from BNC. A) A decrease in the 5200 cm−1 and 6890 cm−1 absorbances is observed in spectra acquired at 5 minute intervals over 3 hours, reflecting evaporation of water. The spectra are offset to illustrate the differences, with earlier time point spectra above and later time point spectra below. B) NIR spectra from a BNC sample after one hour of drying and from a lyophilized sample. The NIR absorbance at 5200 cm−1 arises from “free and bound” water and the NIR absorbance at 6890 cm−1 arises from “free “water. Decrease in integrated area under NIR absorbance at C) 5200 cm−1 and D) 6890 cm−1 obtained from BNC samples imaged at 5 minutes intervals.

