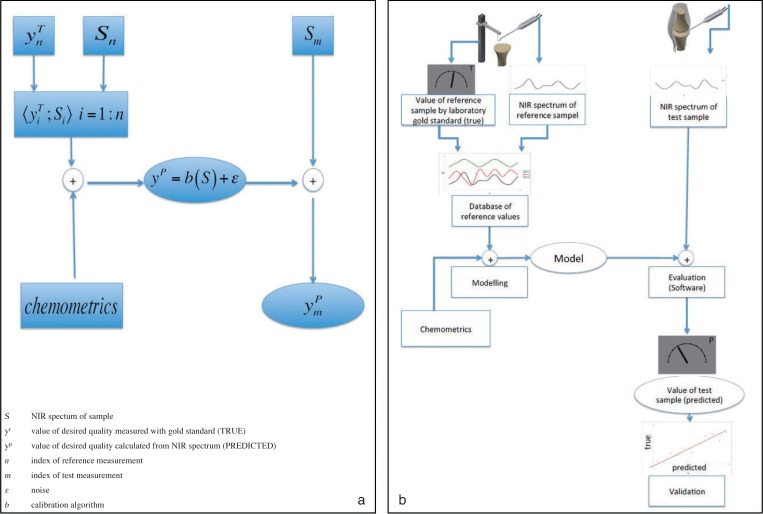
Figure 2.
Schematic diagram of biophotonic test setup, validation and evaluation. (a) Model and formula of calculating the dependent variable from a NIR spectrum. (b) Typical steps of NIRS measurement. To create a model algorithm a set of reference data has to be recorded and analysed by chemometric tools.

