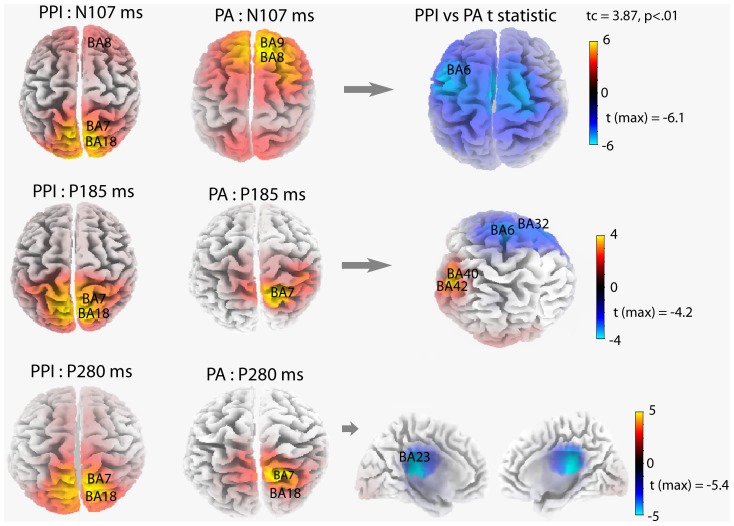
Figure 4. Source localization computed with sLORETA for N100 (107 msec), P200 (185 msec), and P300 (280 msec) components of the ERPs to prepulse inhibition (PPI) trials (left maps) and pulse-alone (PA) trials (middle maps).
t-Test maps of PPI vs PA trials are reported in the right panel. Brodmann areas of maximal sLORETA values for ERP waves to PPI and PA trials and their significant differences are reported on each 3D map.

