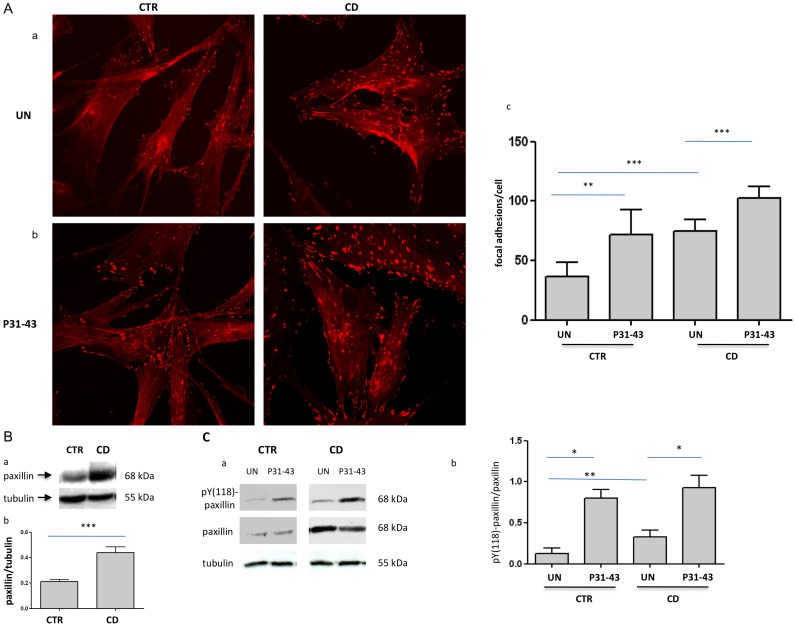
Figure 2. Analysis of the focal adhesion number and paxillin protein levels in CD and controls fibroblasts before and after P31-43 treatment.
A. Increase of the focal adhesion number in CD, as revealed through paxillin staining before and after P31-43 treatment. a) Confocal immunofluorescence images of fibroblasts from CD patients and controls stained with antibodies against paxillin. Representative fields. b) Confocal immunofluorescence images of fibroblasts stained with antibodies against paxillin from CD patients and controls treated with P31-43 for 30 min. Representative fields. c) Statistical analysis of the number of paxillin-positive focal adhesions per cell before and after P31-43 treatment. Focal adhesions of 30 fibroblasts of several fields from 3 independent experiments from 6 patients and 6 controls were counted. Columns represent the means, and the bars represent the standard deviations. Student's t-test. ** = p<0.01; *** = p<0.001. B. Paxillin protein levels are increased in fibroblasts from CD patients with respect to controls. a) Western blot analysis of fibroblast protein lysates from controls and CD patients. The upper line is stained for paxillin, and the lower line is stained for tubulin. Representative experiment. b) Densitometric analysis of western blots stained for paxillin in fibroblasts from 6 CD patients and 6 controls. Paxillin levels were normalized to the tubulin levels. Columns represent the means, and the bars represent the standard deviation. Student's t-test. *** = p<0.001. C. Paxillin phopshorylation is increased in CD fibroblasts and is further increased after P31-43 treatment for 30′. a) Western blot analysis of fibroblast protein lysates from controls and CD patients. The upper line is stained for pY-paxillin, the middle line is stained for paxillin, and the lower line is stained for tubulin. Representative experiment. b) Densitometric analysis of western blots stained for pY-paxillin and paxillin in fibroblasts from 5 CD patients and 5 controls. pY-paxillin levels were normalized to the paxillin levels. Columns represent the means, and the bars represent the standard deviation. Student's t-test. * = p<0.05; ** = p<0.01.

