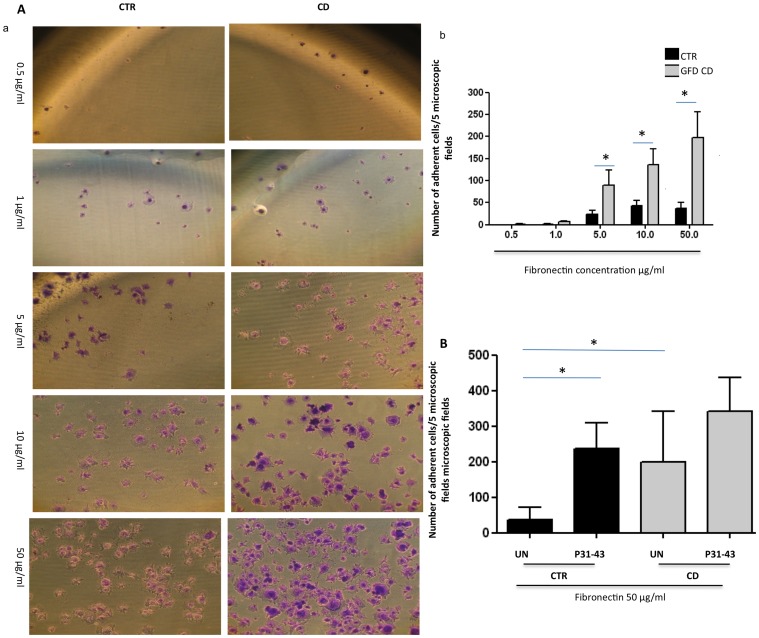
Figure 5. Fibronectin adhesion of CD fibroblasts respect to controls.
A. CD fibroblasts adhered more than controls to fibronectin. a) Transmitted light images of crystal violet stained fibroblasts from CD patients and controls, seeded for 1 h on increasing concentrations of fibronectin, as indicated. Representative fields. b) Statistical analysis of the number of adherent fibroblasts from CD patients and controls seeded on different concentrations of fibronectin, as indicated. For each fibronectin concentration, the fibroblasts of 5 fields from 3 independent experiments with 5 patients and 5 controls were counted. Columns represent the means, and the bars represent the standard deviations. Student's t-test. * = p<0.01. B. P31-43 increased adhesion to fibronectin. Statistical analysis of the number of adherent fibroblasts from CD patients and controls seeded on 50 µg of fibronectin after P31-43 treatment for 1 h. Fibroblasts in 5 fields from 3 independent experiments with 5 patients and 5 controls were counted. Columns represent the means, and the bars represent the standard deviations. Student's t-test.

