
Figure 6. Effects of OA and MA on expression of α-glucosidase (A) and α-amylase (B) as determined by Western blotting of control, OA, MA, metformin and insulin-treated small intestine tissues of non-diabetic and STZ-induced diabetic rats.
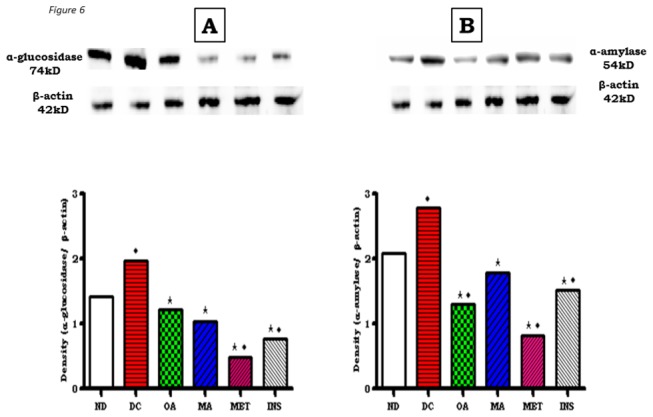
Values are expressed as mean ± S.E.M. Values were obtained from Western blots for six preparations.
★ p <0.05 by comparison with respective control animals.
◆ p <0.05 by comparison with respective non-diabetic animals.