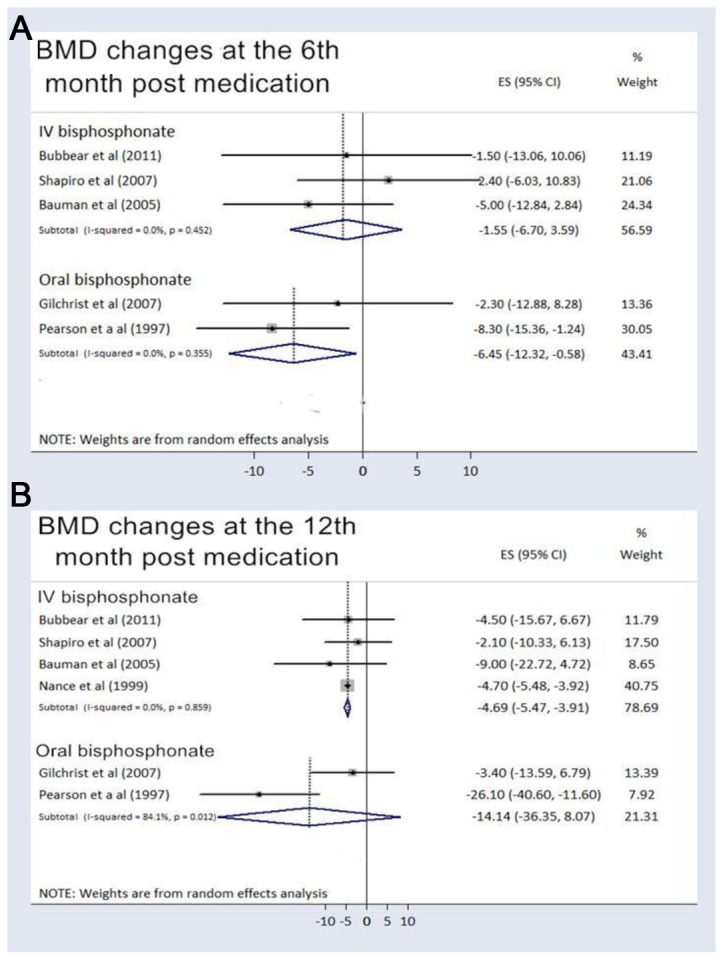
Figure 3. Percent bone mineral density changes categorized by the route of administration.

The figure represents the forest plot of percent bone mineral density (BMD) change from baseline in the acute spinal cord injury patients using bisphosphonates categorized by the route of administration at (A) the 6th and (B) the 12th month following intervention.
