
Figure 2. Distribution of measured capsids diameters and tail lengths.
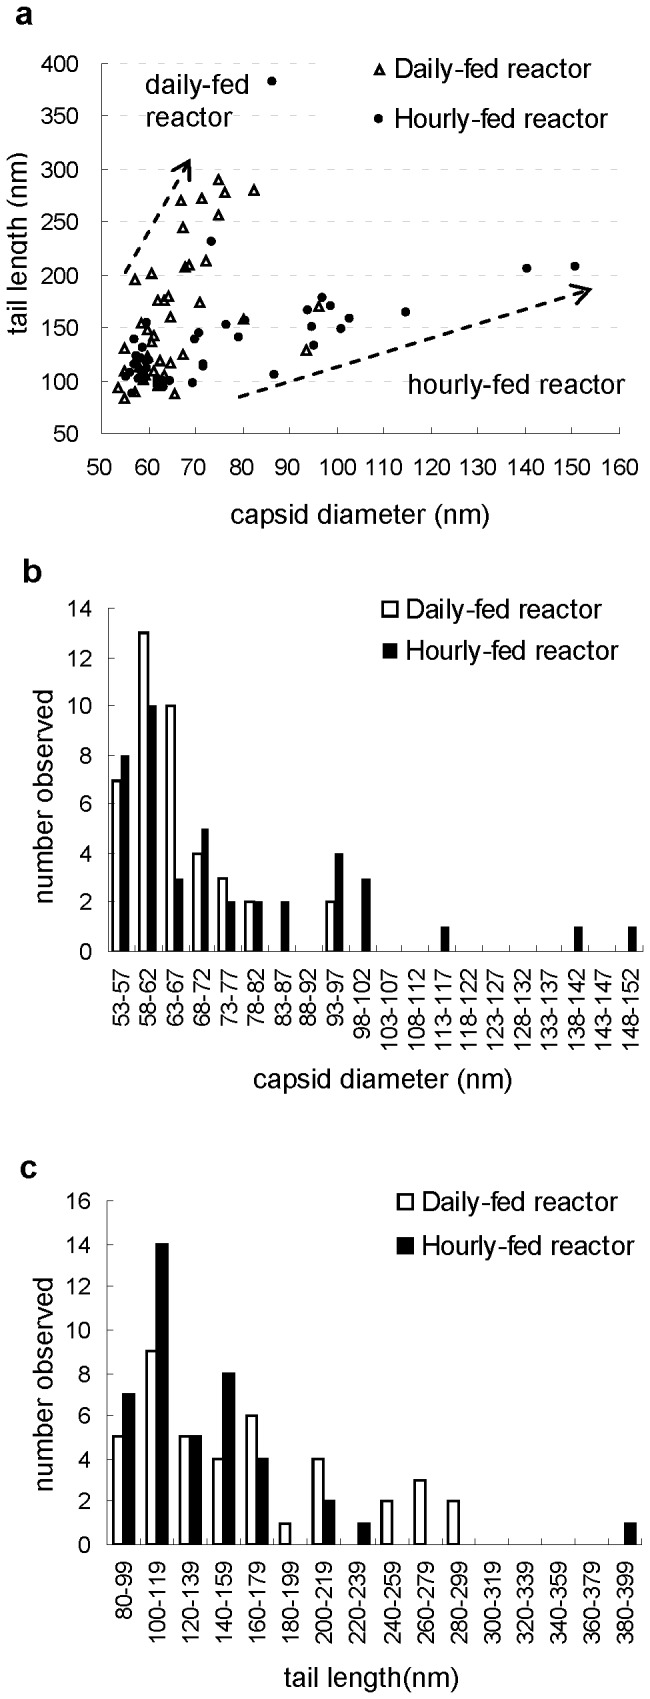
41 virus-like particles (VLPs) from the daily-fed reactor and 42 VLPs from the hourly-fed reactor were measured. a XY scatter chart, b size of capsids: X-axis shows capsid diameters and Y-axis shows number observed, c tail lengths: X-axis shows tail lengths and Y-axis shows number observed.