
Fig. 1.
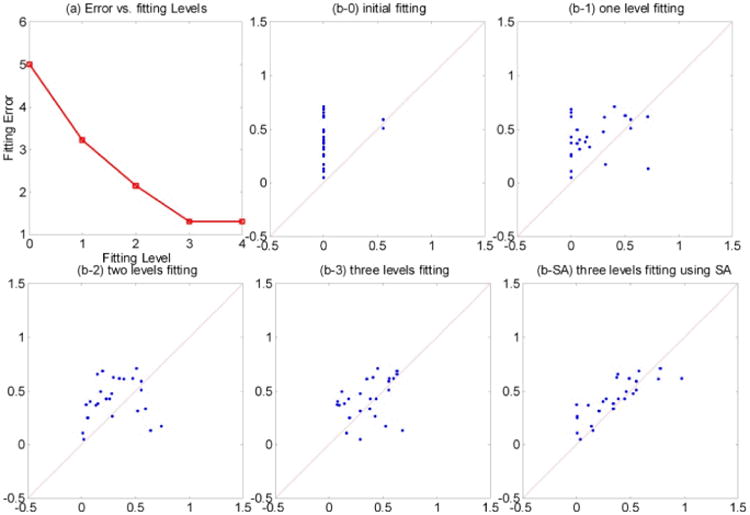
(a) Fitting errors vs. fitting levels in one study participant. (b-0 through b-3) Functional by structural hierarchical (FSH) mapping results in the same subject using 0, 1, 2, and 3-level structural maps. The y axis indicates observed fMRI % signal change and the x axis the predicted fMRI % signal change (data points that are perfectly predicted by the proposed method would lie along the x=y line). (b-SA) The 3-level linear fitting in addition to the simulated annealing (SA) step. Visually, the SA step further improves data fitting.