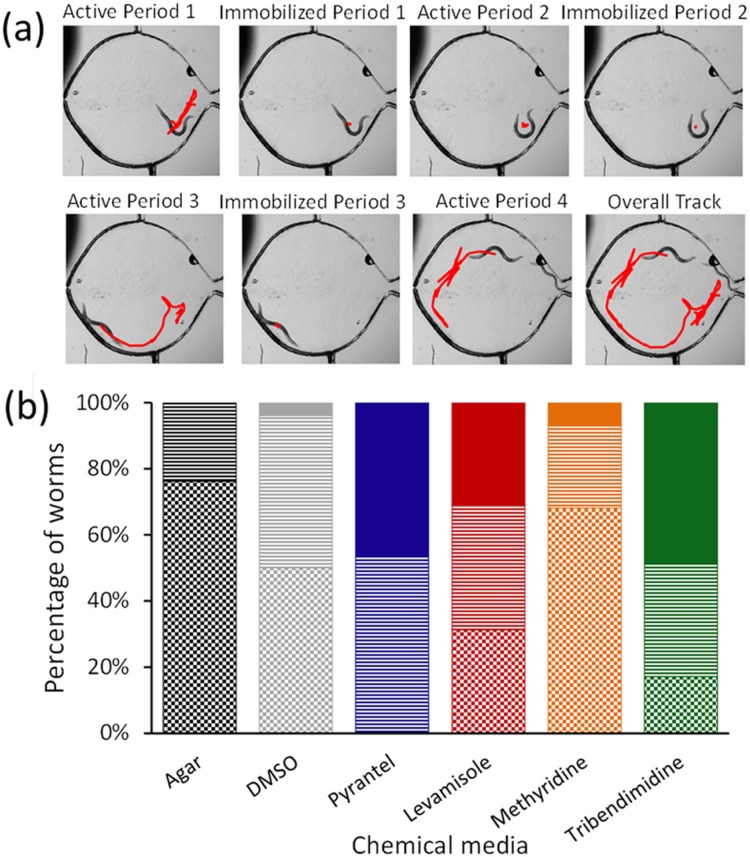
Figure 5.
Immobilization patterns leading to paralysis. (a) Snapshots of a representative worm undergoing periods of being active and temporarily immobilized. A custom worm tracking program25 is used to mark the x-y co-ordinates of the worm's body centroid as a function of time (shown in red). (b) The plot shows the percentage of worms that are active (shaded as checkerboard), temporarily immobilized (shaded as horizontal lines), or permanently immobilized (shaded as solid) at the end of 40 min of drug exposure.

