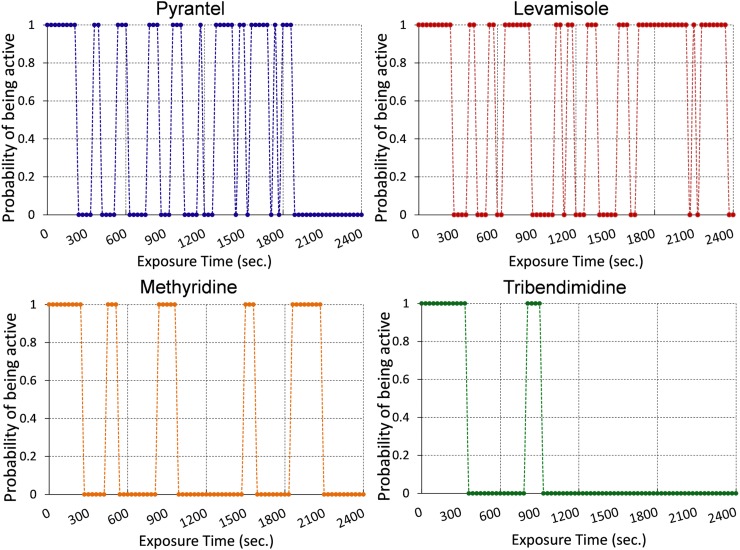
Figure 7.
The figure shows the probability of a worm being active during the length of drug exposure. The median of time durations for active and immobilized periods are calculated from Figure 6. The probability of a worm being active is denoted as 1 while that of being immobilized is denoted as 0.

