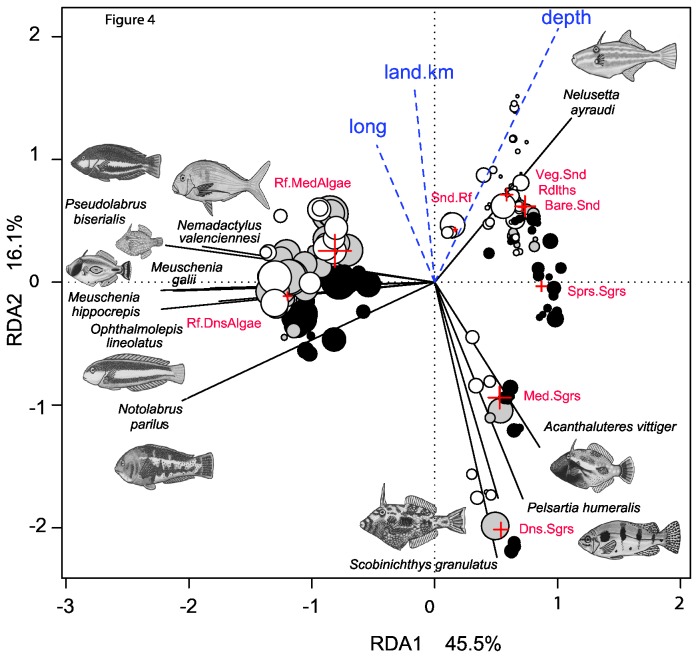
Figure 4. Ordination of transformed species abundance (4th root MaxN) constrained by longitude, distance from the coast, depth (in blue), and habitat category (in red; a factor with nine levels, defined in the methods).
Symbols are scaled by species richness. Fitted site constraints are shaded as: Esperance (black), Duke of Orleans Bay (grey) and Cape Arid (open symbols). Only the top 15% of species eigenvectors are shown.

