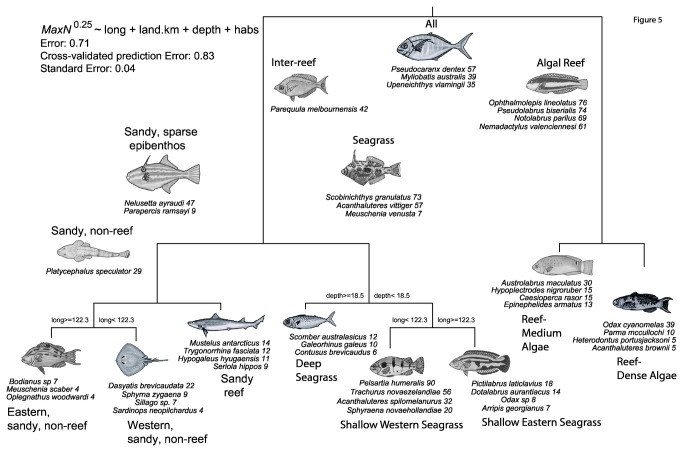
Figure 5. Multivariate regression tree analysis of transformed (4th root MaxN) relative abundance of 90 species of fish constrained by the longitude of sampling sites, depth, and nine habitat categories.
Full details of node names and DLI are given in Table 2.

