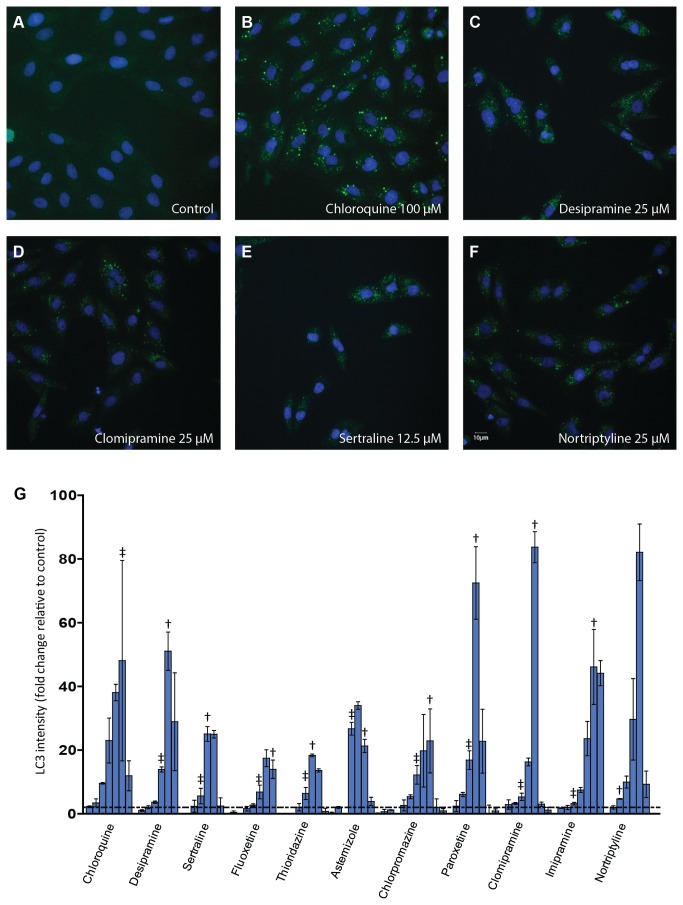
Figure 2. Autophagy modulation by the tested compounds.
H9c2 cells were treated with compounds for 24 h. LC3 immunofluorescence staining was conducted to monitor autophagy change. (A-F) Representative LC3 images from the various indicated treatments are shown. (G) Concentration response plots of LC3 change after quantitative image analysis. The fold change of LC3 intensity compared to control was plotted for each compound and data are expressed as mean ± SD. For each compound the concentration rage tested is from 1.5 µM (left) to 100 µM (right). The dotted line depicts 2-fold of the control LC3 intensity. The Assay was repeated three times. †: the maximum concentration with viability > 70%, ‡: the maximum concentration with viability > 90%.

