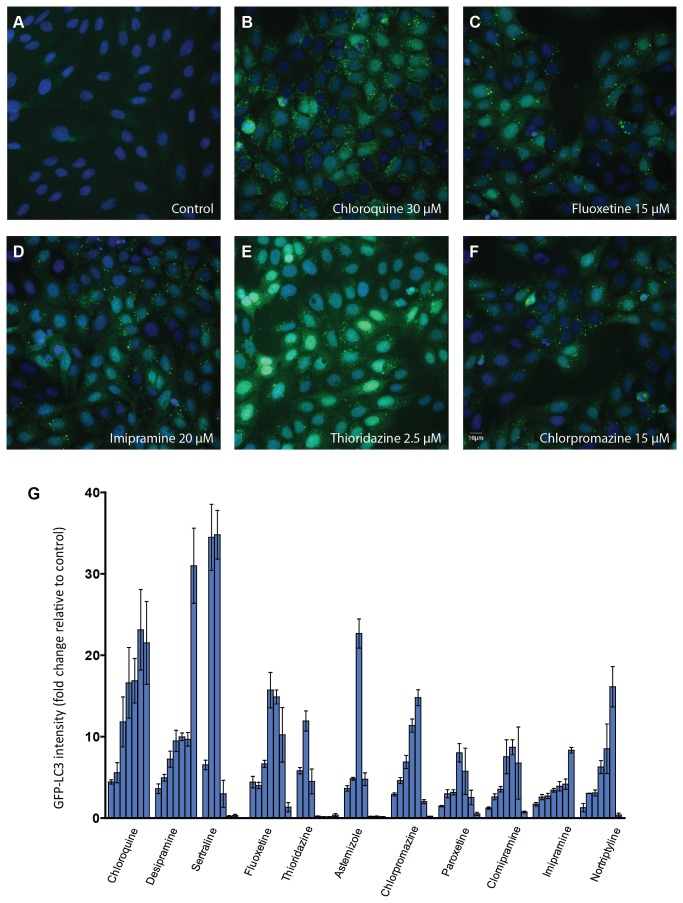
Figure 3. Punctate GFP-LC3 accumulation upon compound treatment.
U2OS cells stably expressing GFP-LC3 were incubated with compounds for 24 h. GFP-LC3 and nuclei were visualized by automated microscopy as described in Materials and Methods. (A-F) Representative images from the various indicated treatments are shown (G) Concentration response plots of GFP-LC3 change after quantitative image analysis are shown. The fold change of GFP-LC3 intensity compared to control was plotted for each compound and data are expressed as mean ± SD. For each compound the concentration rage tested is from to 2.5 µM (left) to 50 µM (right). The assay was repeated three times.

