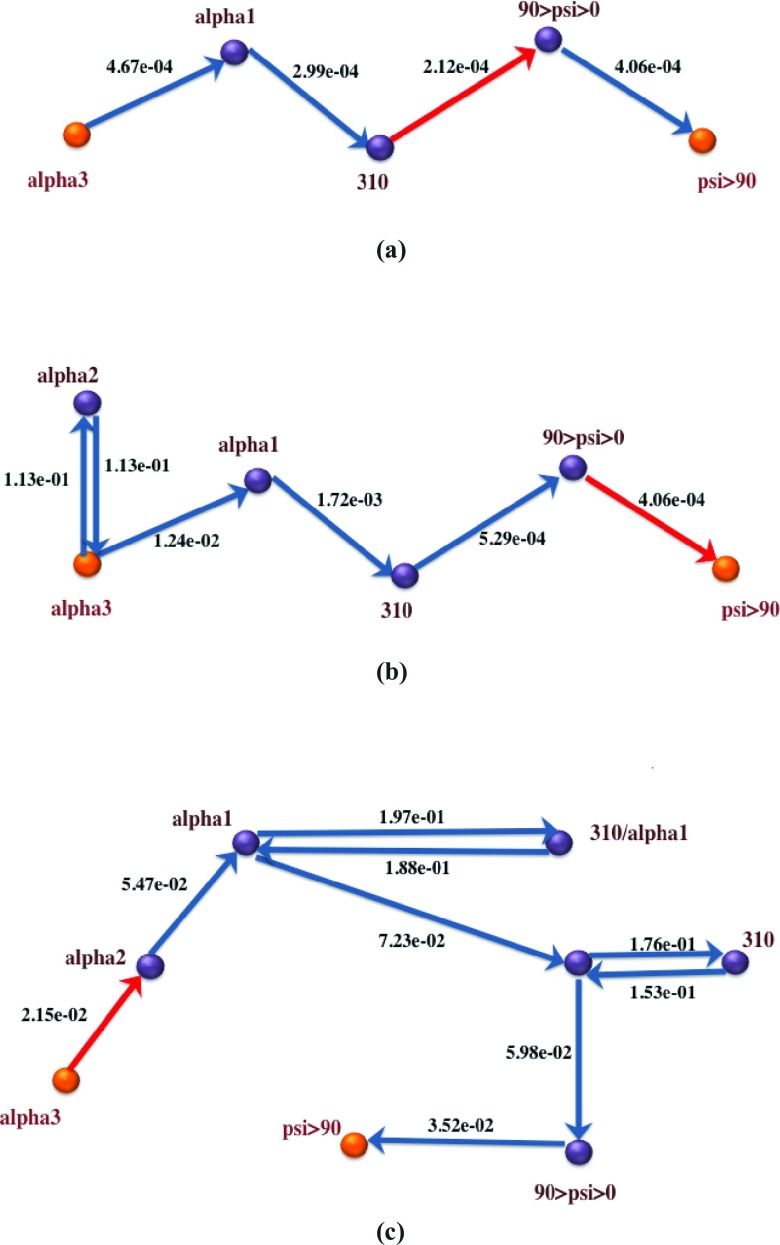
Figure 10.
Global maximum weight paths using three different graph representations for helix unfolding under 70 pN stress. Bottleneck edges (EMW) are in red. (a) 70pN, Path from state-space graph based on flux-based edge weights; (b) 70pN, Path from flux-space graph based on flux-based edge weights; (c) 70pN, Path from flux-space graph based on rate coefficients.

