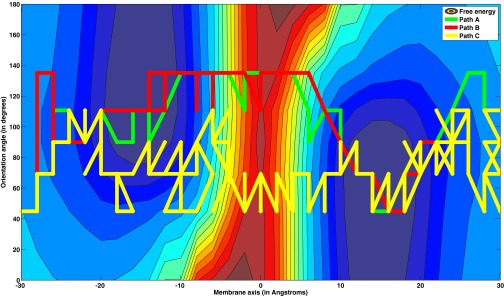
Figure 11.

Global maximum weight paths using three different graph representations for membrane permeation of DOPC. The path descriptions are as follows: Path A: Path obtained from the state-space graph with flux-based weights. Path B: obtained from the flux-space graph with flux-based weights. Path C: obtained from the flux-space graph weighted by local rate coefficients.
