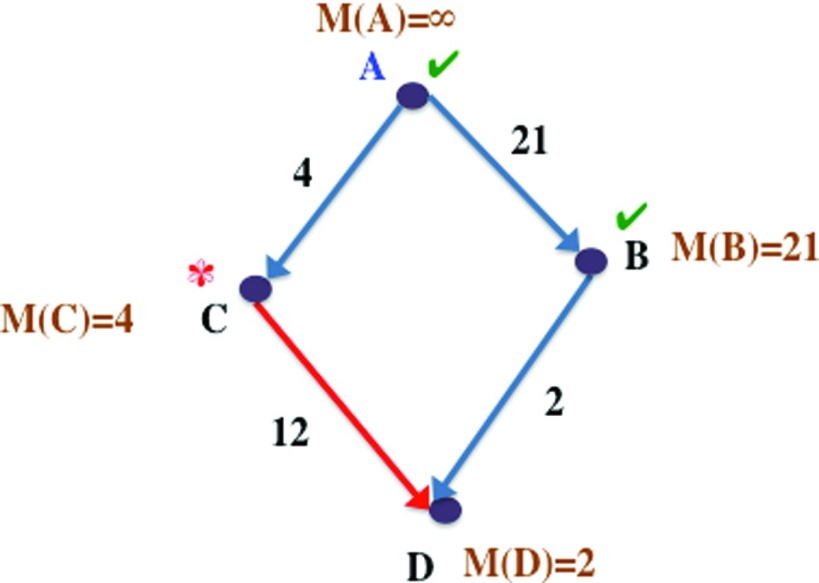
Figure 5.
Example graph demonstrating single-source maximum weight algorithm. This is a snapshot during the optimization process and not the final result. See text for more details. We are calculating the maximum weights from A to all other vertices. Weights marked by M are current estimates of the maximum weight from vertex A to a given vertex. Vertices that have already been explored by the algorithm are marked with ✓ and current vertex being examined is marked with *.

