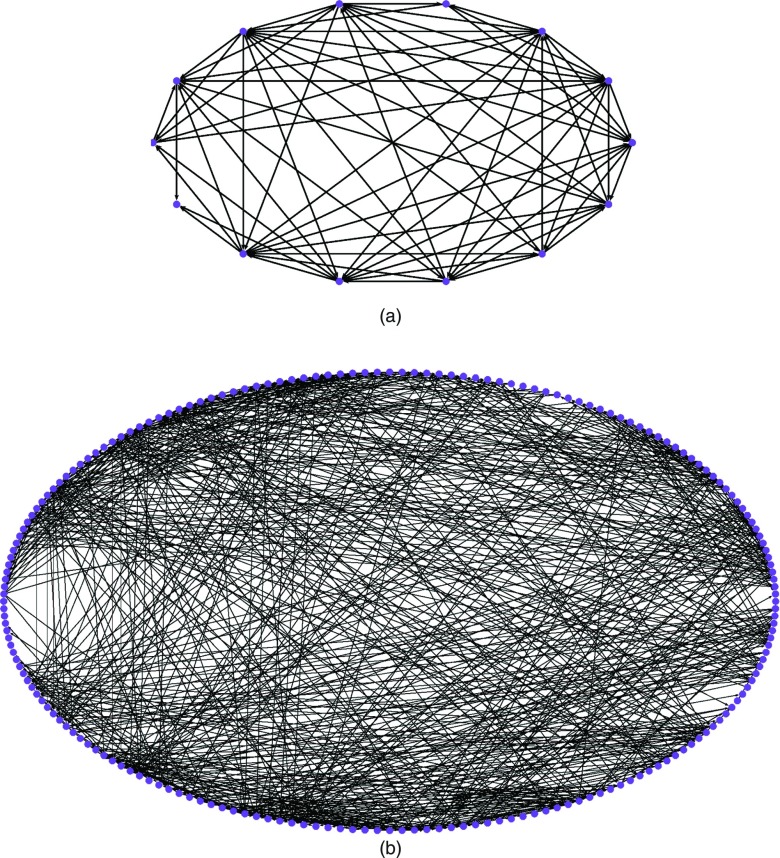
Figure 7.
Visualization of average networks for helix unfolding under a load level 30 pN in (a) state-space, with 14 anchors (vertices). (b) flux-space with 125 milestones (vertices). The graphs are to illustrate the complexity of analysis and were prepared with the Pajek program.43

