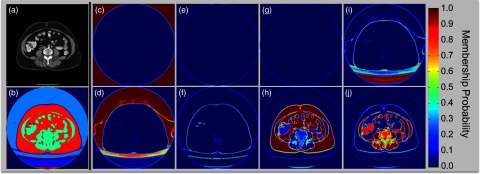
Figure 3.

Proposed texture analysis. (a) Original CT image; (b) Hard segmentation of different structures; (c)–(j) illustrate the membership probability for each of the eight clusters, which are estimated from fuzzy c-means clustering on texture features extracted by Gabor filters. Within each cluster, the probability value indicates partial membership to the cluster. Note that fat tissue and muscles can be identified from (h) and (j), respectively. (b) is constructed by the modes of among the eight clusters for all voxels, where we note that the muscles and fat tissue are effectively partitioned for assistance of the following edge-based level set segmentation.
