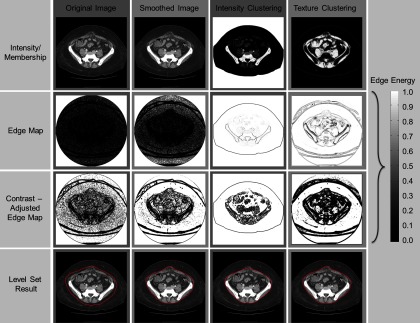
Figure 4.

Edge map and level set results of four methods. The four columns illustrate the results on the original image, the image smoothed by an anisotropic filter, the membership estimated by an intensity-based fuzzy c-means clustering, and the membership estimated by a texture-based fuzzy c-means clustering, respectively. The first row shows the intensity images (first two columns) and membership images (last two columns). The second row shows the edge maps directly derived from the images of the first row. The third row illustrates the contrast-adjusted edge maps for ease of level set evolution. Note that the level set front tends to proceed at brighter regions, and to stop at darker regions on the edge map. The fourth row presents the level set results (represented with red contours) on anterior abdominal wall segmentation for four methods with the same parameters.
