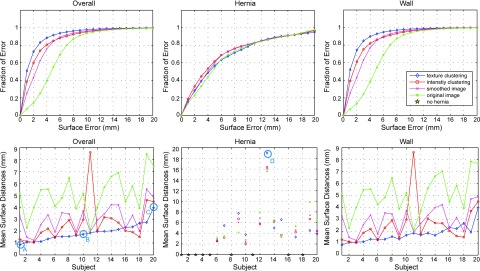
Figure 6.

Quantitative results of anterior abdominal wall segmentation. Four level set methods based on different edge maps (1. Green star: baseline original image; 2. Magenta cross: smoothing image; 3. Red circle: intensity clustering; 4. Blue diamond: texture clustering) are evaluated in terms of surfaces distances. The first column denotes the error metrics for the whole wall, while the second and the third column focuses on the hernia region and the normal wall region, respectively. The top row illustrates the cumulative fraction of region based on increasing 3D surface distance error between interpolated wall from manually labeled ground truth and the automatic segmentation. The bottom row shows the error bar of mean surface distances. The subject indices are sorted in terms of the mean of the overall mean surface distances of the texture clustering method. Note that 9 out of 20 subjects have no hernia labeled in the truth, which is indicated as gold stars in the middle-bottom plot. Four subjects (a, b, c, d) are selected to illustrate the qualitative results in Fig. 7.
