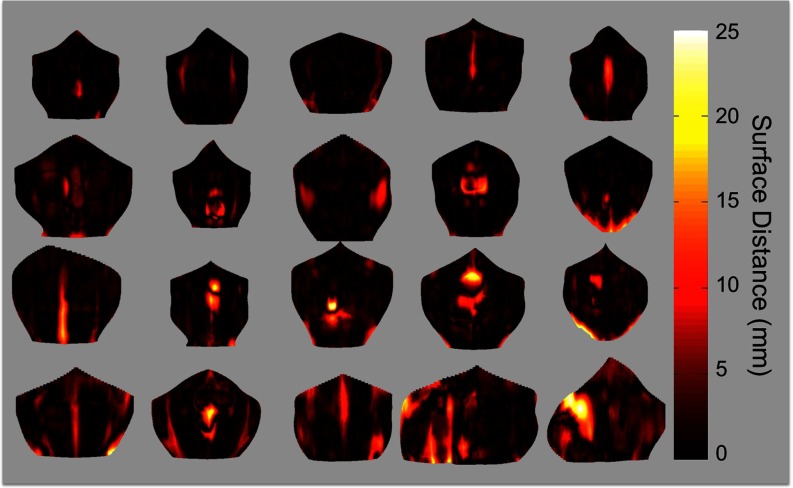
Figure 8.
Error maps for 20 subjects. The shape of the error map is provided by a thin-plate spline interpolation of the anterior abdominal wall on manual labeled meshes, where the lateral boundaries of the interpolated surface are also given by thin-plate spline interpolation, but on the terminations of the label meshes. The rendering color represents the 3D surface distance from the automated segmentation to the interpolated abdominal wall. Note that errors are most prominent in fascia and hernia regions.

