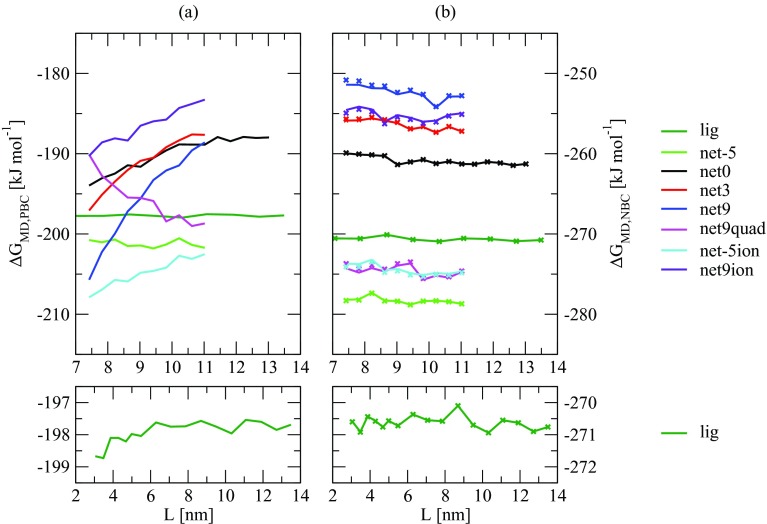
Figure 4.
Raw and corrected charging free energies are shown as a function of the box size for the different systems considered. (a) Raw ligand charging free energies ΔGMD,PBC based on the MD simulations corresponding to the eight different systems (Table 1), displayed as a function of the box edge L. (b) Corresponding corrected charging free energies ΔGMD,NBC. Top row: all systems. Bottom row: lig system only, also considering smaller box sizes and represented on a smaller free-energy scale. The corrected values are obtained by application of either the numerical (Eq. 10; solid lines) or the analytical (Eq. 11; crosses) correction scheme. In both cases, the correction relies on PB calculations with a probe-contact solvent-accessible surface based on a probe radius RS = 0.14 nm (CTC(0.14)). The data are reported numerically in Table 2. A corresponding figure for RS = 0.10 nm (CTC(0.10)) can be found in Figure S1 of the supplementary material.154

