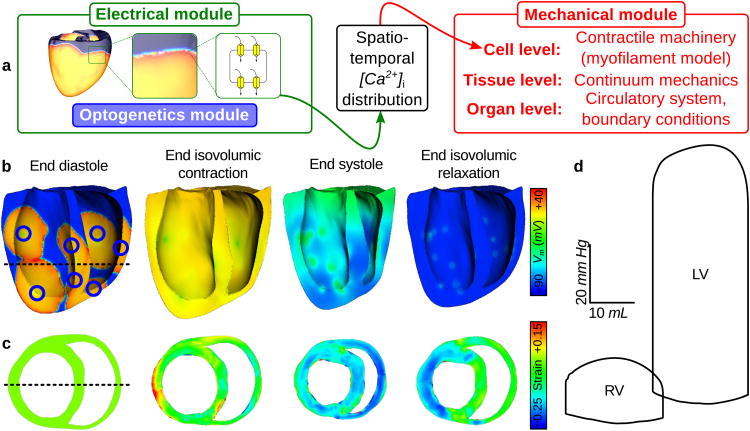
Figure 7. Electromechanical response to optical stimulation in canine ventricles.
(a) The electrical component (green), which encapsulates optogenetic framework model features (blue), is coupled with the mechanical component (red) by passing 3D intracellular [Ca2+] distribution from the ionic model to a cell-level myofilament model at each time step. (b&c) Long-axis membrane voltage (Vm) and short-axis strain profiles (unitless) during the cardiac cycle. Illumination delivered 12.8 mW mm−2 to 10 ventricular ChR2 delivery sites (blue circles) for 10 ms at t = 0. Delivery sites were hemispherical (3mm diameter) with consolidated CD expression. Dashed line in (b) shows position of slice in (c) and vice-versa. Strain was measured with respect to the end diastolic state. PS fibres were simulated but were not rendered graphically; regions of delayed repolarisation due to long intrinsic PS action potential duration are visible in (b). (d) LV and RV pressure-volume (PV) loops for the photoevoked response. These PV loops matched those for sinus rhythm very closely (cross correlation coefficient γ > 0.9). The 10-site illumination pattern shown here resulted in a more vigorous contraction compared to optical pacing from the endocardial apex only (7.34% increase in stroke volume), due to increased depolarisation synchrony (see Supplementary Fig. S2).

