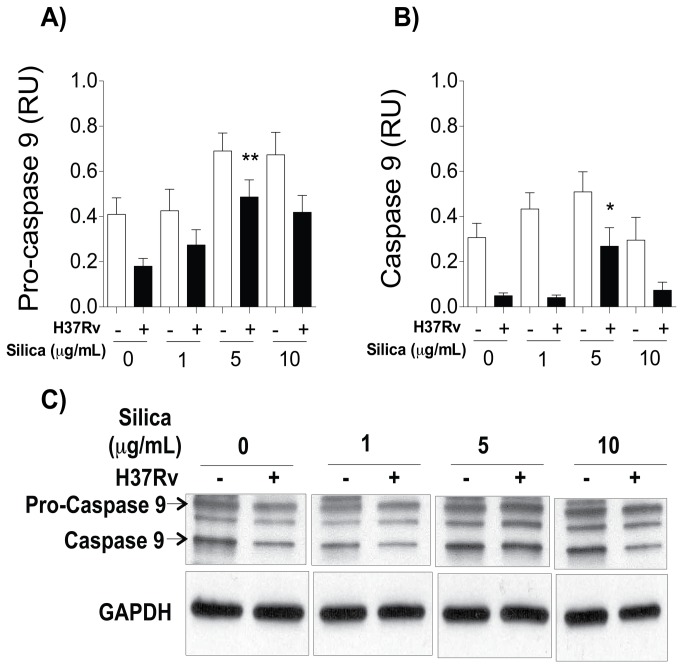
Figure 5. CS increased pro-caspase and caspase 9 levels in macrophages.
THP-1 macrophages were exposed to CS at concentrations of 1, 5 and 10 μg/ml for 24 h, then the macrophages were infected with Mtb. Relative units of pro-caspase 9 (A) and caspase 9 (B) are shown; band densities in the Western Blots were normalized against GAPDH. One of the five independent Western Blots for pro-caspase 9 and caspase 9 (C) is represented. Bars indicate mean ± SD. *P<0.05. ANOVA and Dunnett’s post-hoc test compared to unexposed macrophages.

