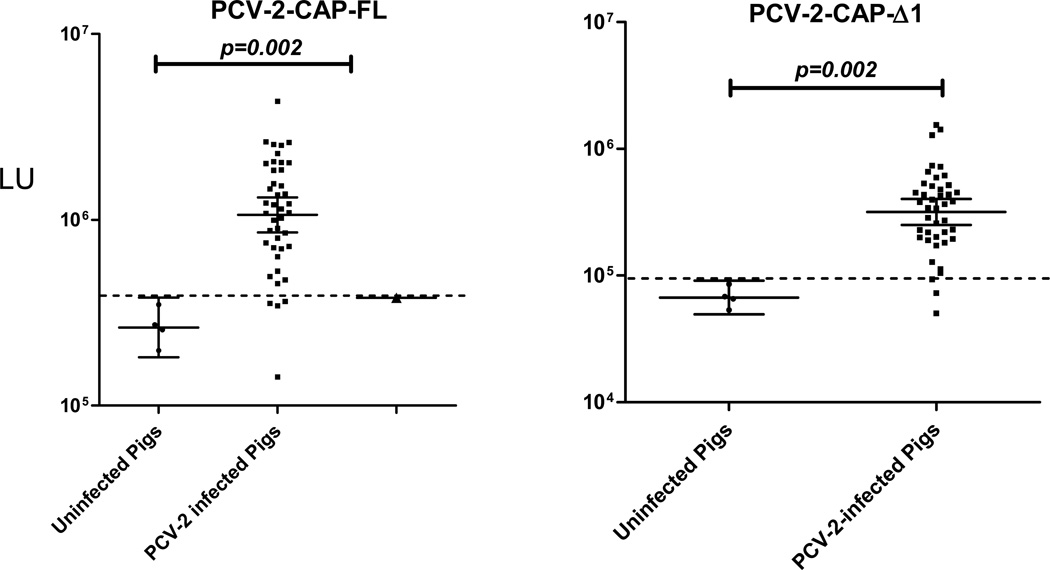
Fig. 2.
LIPS detection of antibodies against two different Renilla luciferase fusion proteins of PCV-2. Antibodies to the PCV-2-CAP-FL and PCV-2-CAP-Δ1 were analyzed by LIPS in 46 porcine serum samples. Each symbol represents individual serum samples tested with each protein fragment and the raw LU values are shown on the Y-axis. The geometric mean and 95% confidence interval of the antibody level are also denoted. The Mann Whitney U test was used to test the statistical significance of the differences between the antibody levels in the PCV-2 positive and PCV-2 negative samples. Raw LU values are shown without subtracting background binding to protein A/G beads. The dashed line represents the diagnostic cut-off, derived from the mean plus 2 standard deviations of the PCV-2 seronegative porcine samples.

