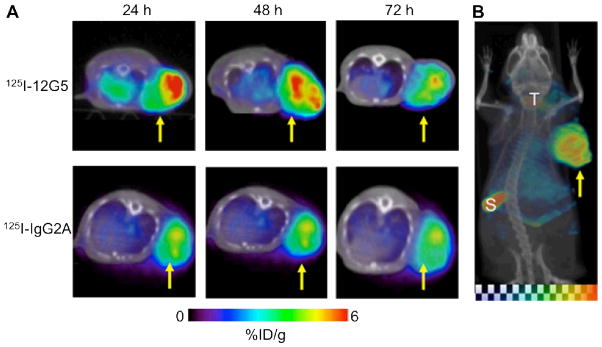
Fig. 4.

SPECT/CT of CXCR4 expression. A. Serial SPECT/CT images of severe combined immunodeficient mice bearing U87 glioblastoma xenografts, after injection with either 125I-12G5 (an anti-human CXCR4 mAb) or 125I-IgG2A (a control antibody) via tail vein. B. A maximum intensity projection image of a mouse injected with 125I-12G5 at 48 h post-injection. %ID/g: percentage of injected dose per gram of tissue; S: spleen; T: thyroid. Arrows indicate the tumors. Adapted from [84].
