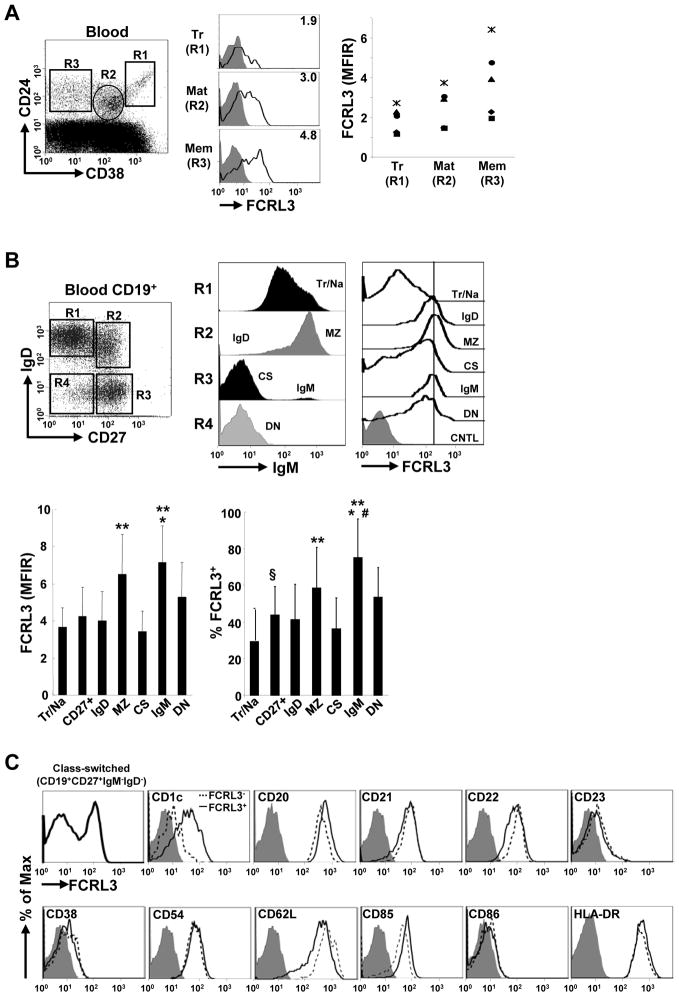
Figure 1. FCRL3 expression increases as a function of B cell maturation and is a distinguishing marker of circulating memory B cell subsets.
(A) PBMCs from healthy adults were stained for the indicated markers and the MFI ratios (MFIR) of FCRL3 expression by transitional (Tr), mature (Mat), and memory (Mem) B cell subsets from five donors were compared. The MFIR was determined by dividing the MFI of the antigen-specific fluorochrome-conjugated mAb by the MFI of the irrelevant conjugated isotype-matched negative control mAb. A representative histogram shows FCRL3 (black line) staining versus an isotype-matched control (gray histogram) and the MFIR values for the gated subsets (R1–R3). (B) Negatively selected CD19+ blood B cells were stained with mAbs to CD19, IgD, CD27, IgM, and FCRL3 versus an isotype control. IgM staining by each subpopulation (R1 – R4) is shown and FCRL3 expression by the six different subsets defined by this combination of markers includes: transitional/naïve (Tr/Na), IgD-only (IgD), marginal zone/natural effector (MZ), class-switched (CS), IgM-only (IgM), and double-negative (DN) memory cells. For simplification, IgG1 control (CNTL) staining for total B cells is shown. The two bar graphs indicate the MFIR and mean frequency of FCRL3 expression by these subsets ± SD as determined by staining 20 healthy donors. ** vs Tr/Na, CD27+, IgD and CS P < 0.01; * vs DN P < 0.05; # vs MZ P < 0.05; § vs Tr/Na P < 0.05 by two-tailed t-test. (C) The class-switched (CS) memory B cell gate (CD19+CD27+IgM−IgD−) was analyzed for the indicated markers on FCRL3 positive (solid line) and negative (dashed line) subsets compared to an isotype-matched control (gray histogram).

