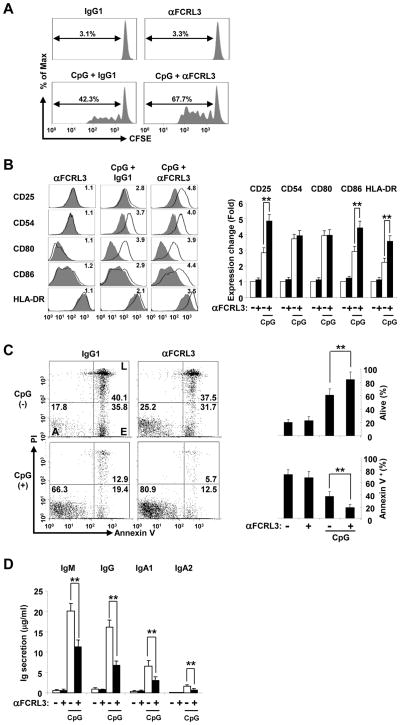
Figure 2. FCRL3 has differential influence on CpG-mediated B cell activation.
(A) Blood B cells purified by negative selection were labeled with CFSE and cultured with biotinylated F(ab′)2 anti-FCRL3 (3 μg/ml) or an IgG1 control plus SA (20 μg/ml) in the presence or absence of CpG (2.5 μg/ml). Cells were harvested on day 4 and CFSE profiles were analyzed by flow cytometry to assess the frequency among total B cells that had undergone dye dilution. (B) FCRL3 promotes CpG-induced activation marker expression. B cells were cultured for 48 hours as in (A). Cells were stained for the indicated markers following stimulation (black line) versus incubation in medium-only (gray histogram). The fold difference in expression indicated in the histogram was calculated by dividing the post-stimulation MFIR of each antigen by the medium-only control stain. Isotype control stains did not vary and were excluded for simplicity. Mean fold differences in expression quantified from three different donors are detailed in the panel to the right. (C) FCRL3 enhances the pro-survival effects of CpG. B cells were cultured in the indicated conditions and collected at 48 hours to analyze apoptosis by propidium iodide (PI) and annexin-V staining. Numbers in the gates represent percentages of alive (A) cells, as well as early (E), and late (L) apoptotic events. Data representative of three different donors are summarized on the right. (D) FCRL3 inhibits CpG-induced Ig production. B cells were treated as above and after four days culture supernatants were assessed for Ig production by capture ELISA. The data presented are mean ± SD of independent experiments from three different donors. ** P < 0.001 vs CpG plus the IgG1 control by two-tailed t-test.

