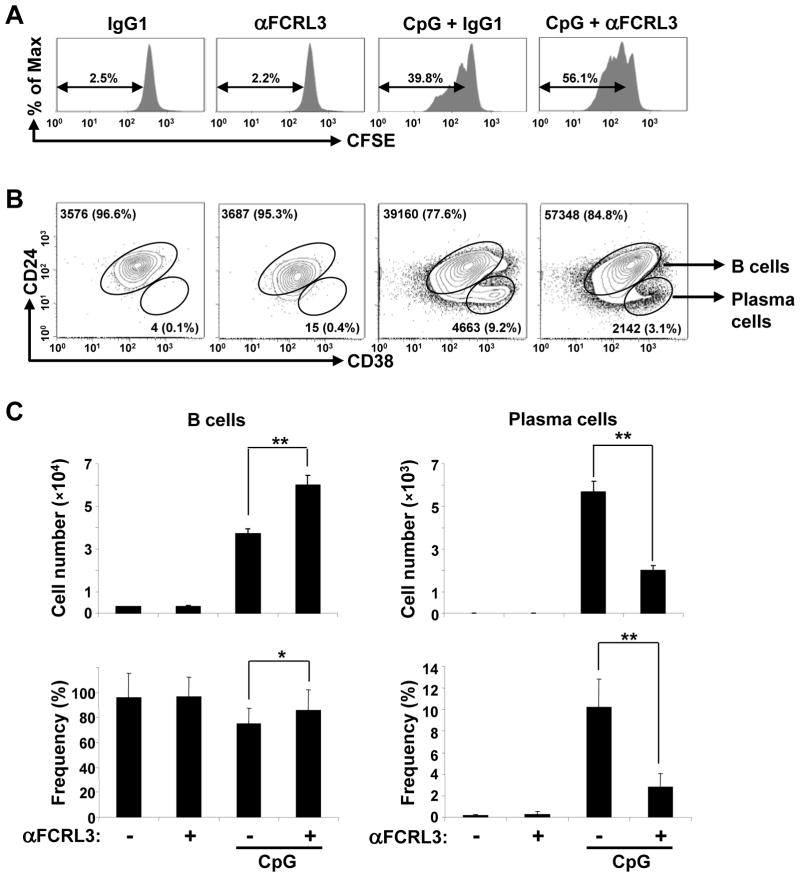
Figure 3. FCRL3 augments B cell division, but inhibits PC production in a CpG-inducible CB differentiation model.
(A) B cells purified from umbilical CB by negative selection were labeled with CFSE and treated as in Fig. 2A. Cells were harvested on day 4 and CFSE profiles were analyzed by flow cytometry to assess the dye dilution frequency among total B cells. (B) CB B cells cultured as above were harvested on day 4 and stained for CD19, CD24, and CD38 to detect B cells (CD24+CD38+) and PC (CD24lowCD38++). The values in the contour plots indicate the total number and frequency of each subset determined for one representative sample and results from triplicate cultures shown as the mean ± SD are quantified in (C). The data are representative of experiments from three different donors. ** P < 0.001 vs CpG plus the IgG1 control; * P < 0.05 vs CpG plus the IgG1 control by two-tailed t-test.

