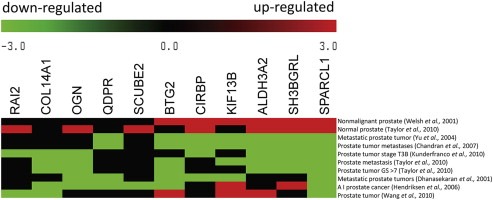
Figure 1.

Co‐expression analysis of the 11 suppressor candidates from the 50‐gene expression signature among CaP studies. Meta‐heat map depicts 11 suppressor candidate gene expression patterns across 10 transcriptional profiling studies in normal or diseased prostate tissue. The different expression profiling studies are represented in rows, and the 11 candidate genes are represented in columns. The colors in the heat map represent the direction of differential gene expression within a given transcriptional profile (red for up, green for down, and black for a missing match). Color intensity reflects the confidence levels of differential expression.
